Central American vs Cree GED/Equivalency
COMPARE
Central American
Cree
GED/Equivalency
GED/Equivalency Comparison
Central Americans
Cree
79.2%
GED/EQUIVALENCY
0.0/ 100
METRIC RATING
327th/ 347
METRIC RANK
85.0%
GED/EQUIVALENCY
15.9/ 100
METRIC RATING
202nd/ 347
METRIC RANK
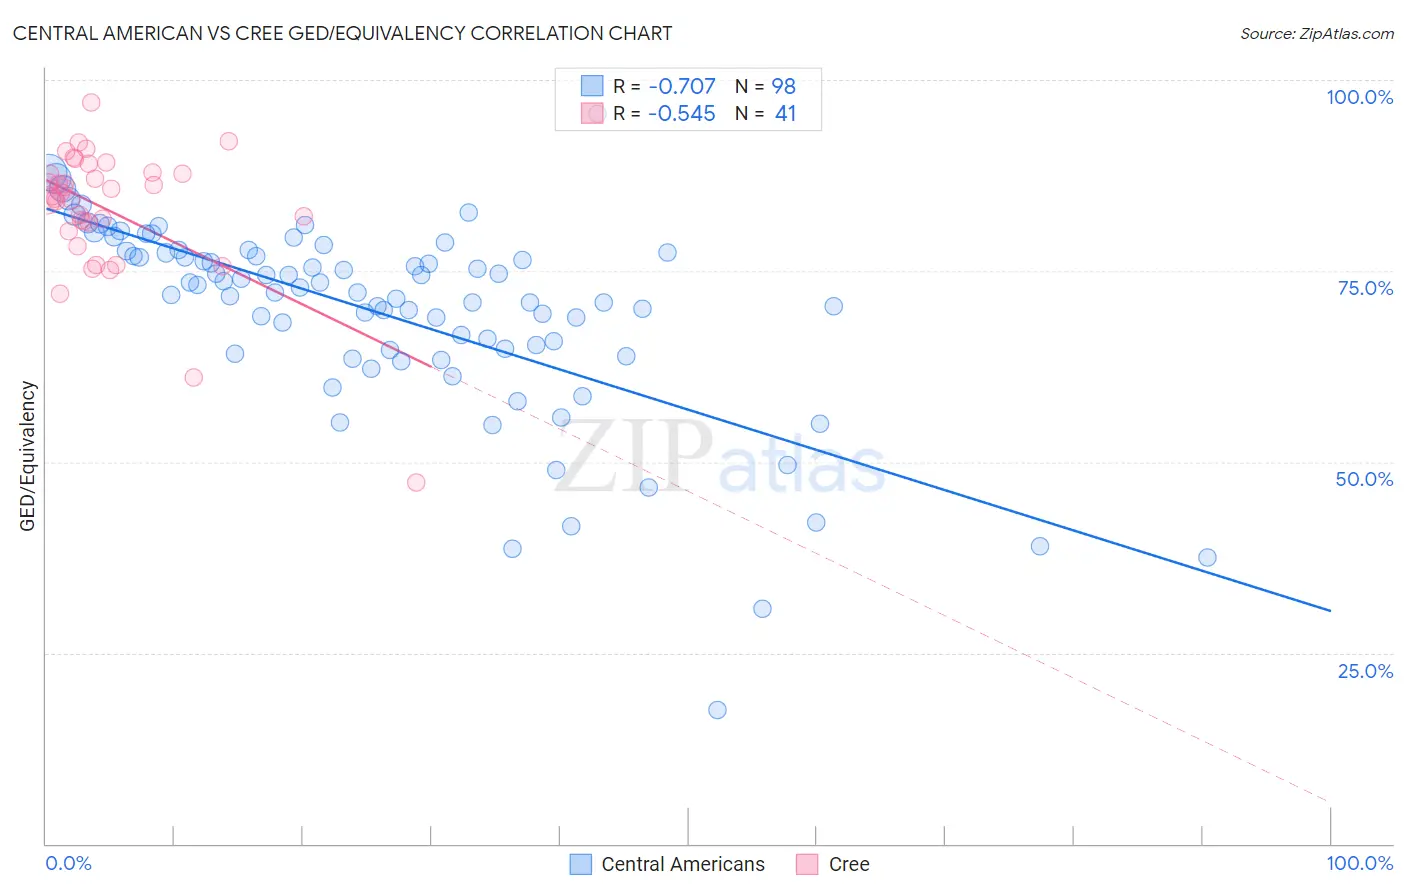
Central American vs Cree GED/Equivalency Correlation Chart
The statistical analysis conducted on geographies consisting of 504,618,995 people shows a strong negative correlation between the proportion of Central Americans and percentage of population with at least ged/equivalency education in the United States with a correlation coefficient (R) of -0.707 and weighted average of 79.2%. Similarly, the statistical analysis conducted on geographies consisting of 76,211,744 people shows a substantial negative correlation between the proportion of Cree and percentage of population with at least ged/equivalency education in the United States with a correlation coefficient (R) of -0.545 and weighted average of 85.0%, a difference of 7.4%.
GED/Equivalency Correlation Summary
| Measurement | Central American | Cree |
| Minimum | 17.6% | 47.4% |
| Maximum | 95.6% | 97.0% |
| Range | 78.0% | 49.7% |
| Mean | 69.4% | 83.0% |
| Median | 72.5% | 84.7% |
| Interquartile 25% (IQ1) | 64.6% | 80.8% |
| Interquartile 75% (IQ3) | 77.4% | 87.8% |
| Interquartile Range (IQR) | 12.8% | 7.0% |
| Standard Deviation (Sample) | 13.0% | 8.7% |
| Standard Deviation (Population) | 13.0% | 8.5% |
Similar Demographics by GED/Equivalency
Demographics Similar to Central Americans by GED/Equivalency
In terms of ged/equivalency, the demographic groups most similar to Central Americans are Yuman (79.2%, a difference of 0.020%), Hispanic or Latino (79.1%, a difference of 0.10%), Honduran (79.3%, a difference of 0.11%), Dominican (79.1%, a difference of 0.15%), and Mexican American Indian (79.4%, a difference of 0.23%).
| Demographics | Rating | Rank | GED/Equivalency |
| Immigrants | Cuba | 0.0 /100 | #320 | Tragic 80.2% |
| Yup'ik | 0.0 /100 | #321 | Tragic 80.0% |
| Lumbee | 0.0 /100 | #322 | Tragic 80.0% |
| Immigrants | Nicaragua | 0.0 /100 | #323 | Tragic 79.9% |
| Mexican American Indians | 0.0 /100 | #324 | Tragic 79.4% |
| Hondurans | 0.0 /100 | #325 | Tragic 79.3% |
| Yuman | 0.0 /100 | #326 | Tragic 79.2% |
| Central Americans | 0.0 /100 | #327 | Tragic 79.2% |
| Hispanics or Latinos | 0.0 /100 | #328 | Tragic 79.1% |
| Dominicans | 0.0 /100 | #329 | Tragic 79.1% |
| Immigrants | Cabo Verde | 0.0 /100 | #330 | Tragic 78.9% |
| Immigrants | Honduras | 0.0 /100 | #331 | Tragic 78.7% |
| Immigrants | Azores | 0.0 /100 | #332 | Tragic 78.7% |
| Salvadorans | 0.0 /100 | #333 | Tragic 78.6% |
| Guatemalans | 0.0 /100 | #334 | Tragic 78.5% |
Demographics Similar to Cree by GED/Equivalency
In terms of ged/equivalency, the demographic groups most similar to Cree are Portuguese (85.0%, a difference of 0.0%), Uruguayan (85.0%, a difference of 0.010%), Somali (85.0%, a difference of 0.020%), Panamanian (85.0%, a difference of 0.020%), and Hawaiian (85.0%, a difference of 0.030%).
| Demographics | Rating | Rank | GED/Equivalency |
| Chippewa | 20.8 /100 | #195 | Fair 85.2% |
| Tongans | 20.7 /100 | #196 | Fair 85.2% |
| Costa Ricans | 20.4 /100 | #197 | Fair 85.2% |
| Immigrants | Africa | 17.5 /100 | #198 | Poor 85.1% |
| Somalis | 16.4 /100 | #199 | Poor 85.0% |
| Uruguayans | 16.0 /100 | #200 | Poor 85.0% |
| Portuguese | 15.9 /100 | #201 | Poor 85.0% |
| Cree | 15.9 /100 | #202 | Poor 85.0% |
| Panamanians | 15.3 /100 | #203 | Poor 85.0% |
| Hawaiians | 15.2 /100 | #204 | Poor 85.0% |
| Liberians | 14.6 /100 | #205 | Poor 85.0% |
| Samoans | 13.7 /100 | #206 | Poor 84.9% |
| Hmong | 13.1 /100 | #207 | Poor 84.9% |
| Marshallese | 12.5 /100 | #208 | Poor 84.9% |
| Colombians | 12.3 /100 | #209 | Poor 84.9% |