Central American Indian vs Alaska Native 10th Grade
COMPARE
Central American Indian
Alaska Native
10th Grade
10th Grade Comparison
Central American Indians
Alaska Natives
89.7%
10TH GRADE
0.0/ 100
METRIC RATING
326th/ 347
METRIC RANK
94.9%
10TH GRADE
99.6/ 100
METRIC RATING
71st/ 347
METRIC RANK
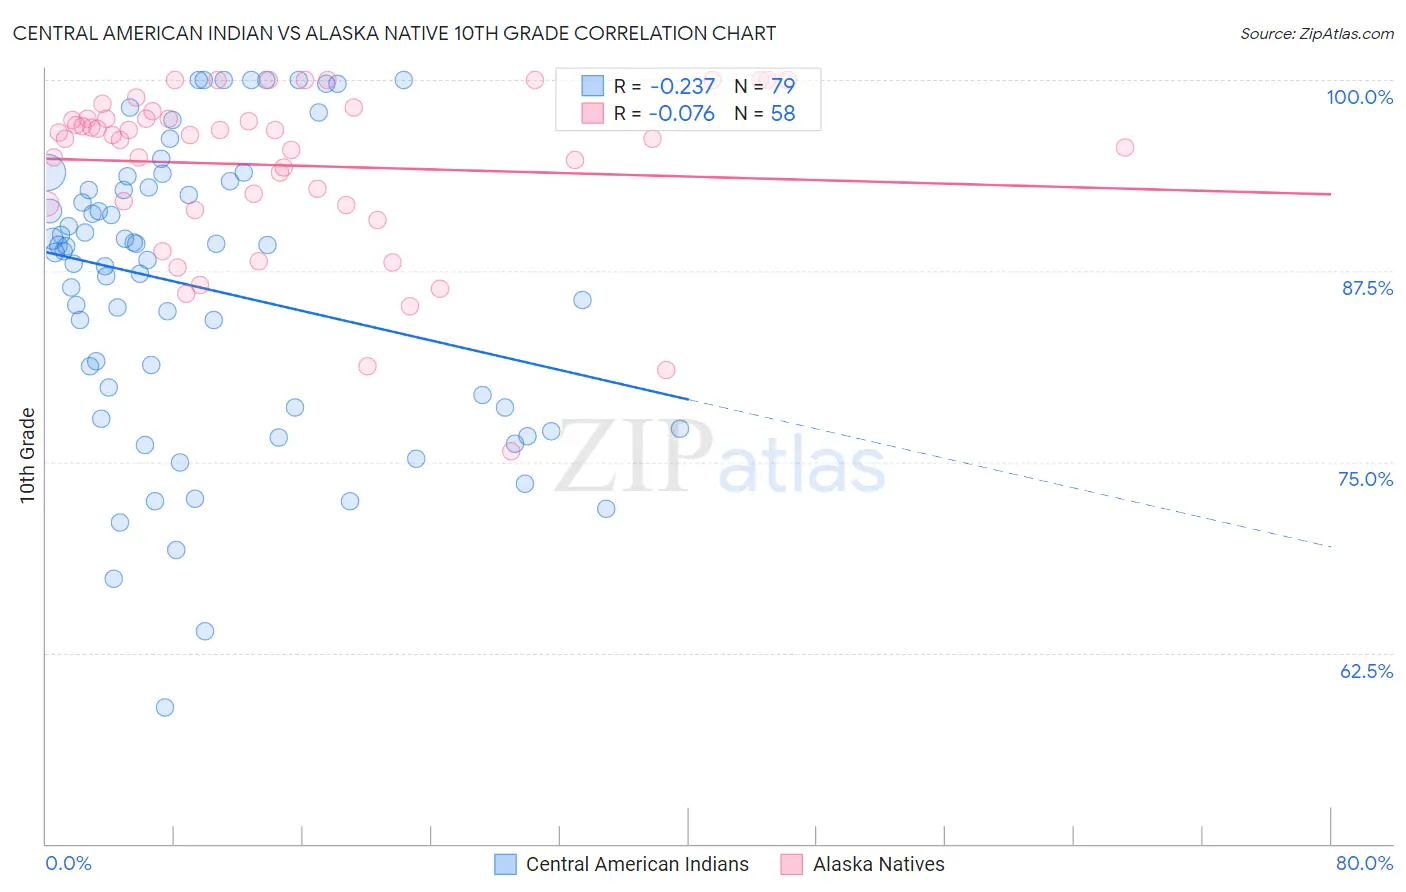
Central American Indian vs Alaska Native 10th Grade Correlation Chart
The statistical analysis conducted on geographies consisting of 326,142,643 people shows a weak negative correlation between the proportion of Central American Indians and percentage of population with at least 10th grade education in the United States with a correlation coefficient (R) of -0.237 and weighted average of 89.7%. Similarly, the statistical analysis conducted on geographies consisting of 76,778,743 people shows a slight negative correlation between the proportion of Alaska Natives and percentage of population with at least 10th grade education in the United States with a correlation coefficient (R) of -0.076 and weighted average of 94.9%, a difference of 5.8%.
10th Grade Correlation Summary
| Measurement | Central American Indian | Alaska Native |
| Minimum | 58.9% | 75.7% |
| Maximum | 100.0% | 100.0% |
| Range | 41.1% | 24.3% |
| Mean | 86.3% | 94.4% |
| Median | 88.8% | 96.4% |
| Interquartile 25% (IQ1) | 78.5% | 91.9% |
| Interquartile 75% (IQ3) | 93.0% | 97.5% |
| Interquartile Range (IQR) | 14.4% | 5.6% |
| Standard Deviation (Sample) | 9.6% | 5.4% |
| Standard Deviation (Population) | 9.6% | 5.4% |
Similar Demographics by 10th Grade
Demographics Similar to Central American Indians by 10th Grade
In terms of 10th grade, the demographic groups most similar to Central American Indians are Puerto Rican (89.8%, a difference of 0.18%), Immigrants from Armenia (89.9%, a difference of 0.20%), Immigrants from Nicaragua (89.5%, a difference of 0.26%), Immigrants from Cabo Verde (89.5%, a difference of 0.27%), and Dominican (89.4%, a difference of 0.37%).
| Demographics | Rating | Rank | 10th Grade |
| Nicaraguans | 0.0 /100 | #319 | Tragic 90.2% |
| Houma | 0.0 /100 | #320 | Tragic 90.2% |
| Belizeans | 0.0 /100 | #321 | Tragic 90.2% |
| Tohono O'odham | 0.0 /100 | #322 | Tragic 90.1% |
| Immigrants | Belize | 0.0 /100 | #323 | Tragic 90.1% |
| Immigrants | Armenia | 0.0 /100 | #324 | Tragic 89.9% |
| Puerto Ricans | 0.0 /100 | #325 | Tragic 89.8% |
| Central American Indians | 0.0 /100 | #326 | Tragic 89.7% |
| Immigrants | Nicaragua | 0.0 /100 | #327 | Tragic 89.5% |
| Immigrants | Cabo Verde | 0.0 /100 | #328 | Tragic 89.5% |
| Dominicans | 0.0 /100 | #329 | Tragic 89.4% |
| Immigrants | Yemen | 0.0 /100 | #330 | Tragic 89.1% |
| Mexican American Indians | 0.0 /100 | #331 | Tragic 89.0% |
| Immigrants | Azores | 0.0 /100 | #332 | Tragic 89.0% |
| Hondurans | 0.0 /100 | #333 | Tragic 89.0% |
Demographics Similar to Alaska Natives by 10th Grade
In terms of 10th grade, the demographic groups most similar to Alaska Natives are Zimbabwean (94.9%, a difference of 0.0%), Immigrants from England (94.9%, a difference of 0.010%), Immigrants from Sweden (94.9%, a difference of 0.020%), Bhutanese (94.9%, a difference of 0.020%), and Canadian (94.9%, a difference of 0.020%).
| Demographics | Rating | Rank | 10th Grade |
| Native Hawaiians | 99.7 /100 | #64 | Exceptional 95.0% |
| Turks | 99.7 /100 | #65 | Exceptional 95.0% |
| Immigrants | Australia | 99.7 /100 | #66 | Exceptional 94.9% |
| Immigrants | Netherlands | 99.7 /100 | #67 | Exceptional 94.9% |
| Immigrants | Belgium | 99.7 /100 | #68 | Exceptional 94.9% |
| Immigrants | England | 99.6 /100 | #69 | Exceptional 94.9% |
| Zimbabweans | 99.6 /100 | #70 | Exceptional 94.9% |
| Alaska Natives | 99.6 /100 | #71 | Exceptional 94.9% |
| Immigrants | Sweden | 99.6 /100 | #72 | Exceptional 94.9% |
| Bhutanese | 99.6 /100 | #73 | Exceptional 94.9% |
| Canadians | 99.6 /100 | #74 | Exceptional 94.9% |
| Okinawans | 99.5 /100 | #75 | Exceptional 94.8% |
| Romanians | 99.5 /100 | #76 | Exceptional 94.8% |
| Immigrants | South Africa | 99.5 /100 | #77 | Exceptional 94.8% |
| Filipinos | 99.3 /100 | #78 | Exceptional 94.8% |