Celtic vs Immigrants from Bolivia 11th Grade
COMPARE
Celtic
Immigrants from Bolivia
11th Grade
11th Grade Comparison
Celtics
Immigrants from Bolivia
93.7%
11TH GRADE
99.5/ 100
METRIC RATING
76th/ 347
METRIC RANK
91.7%
11TH GRADE
2.8/ 100
METRIC RATING
237th/ 347
METRIC RANK
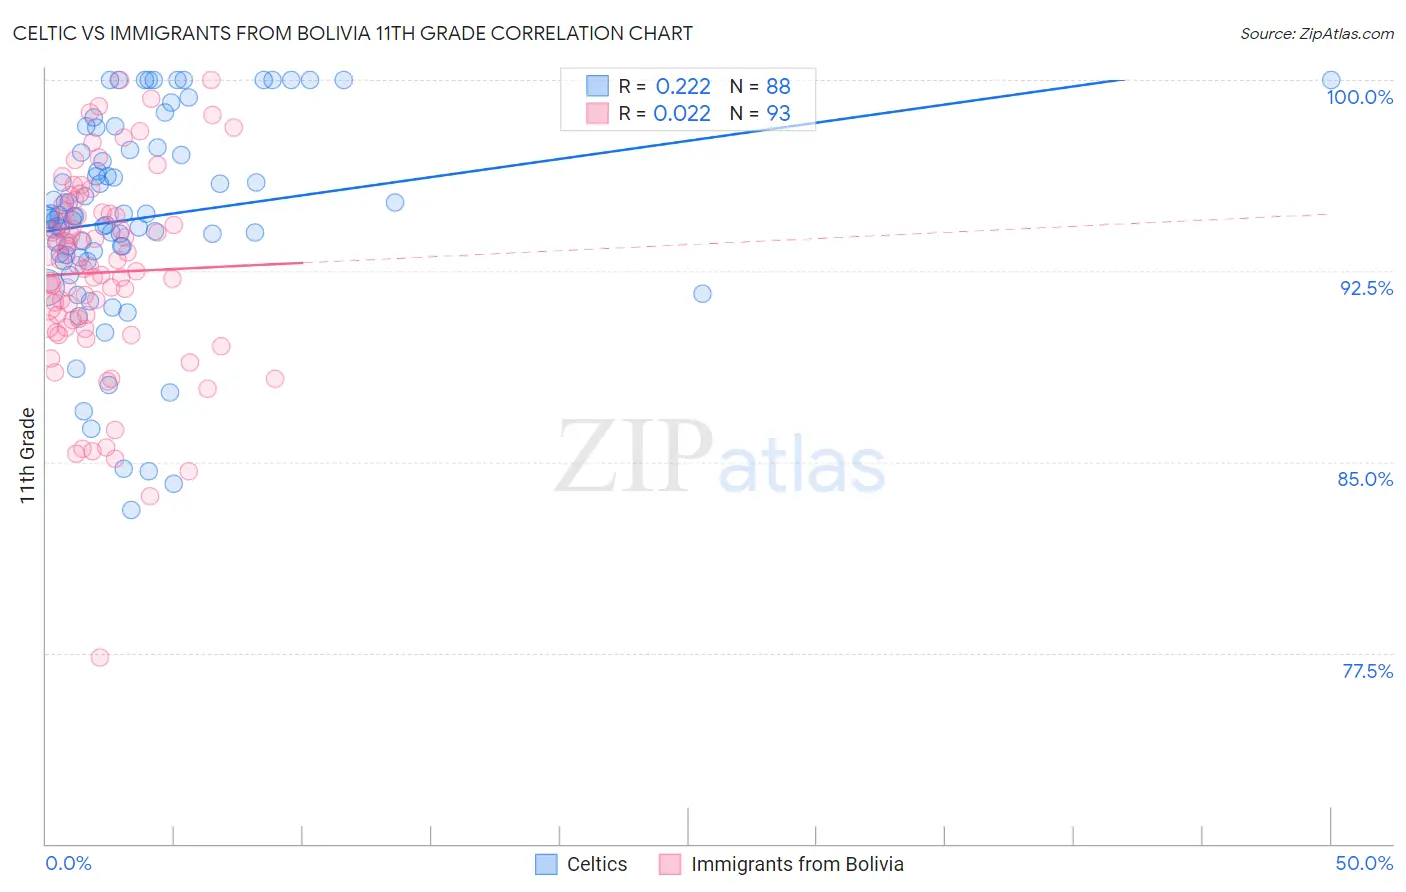
Celtic vs Immigrants from Bolivia 11th Grade Correlation Chart
The statistical analysis conducted on geographies consisting of 168,876,981 people shows a weak positive correlation between the proportion of Celtics and percentage of population with at least 11th grade education in the United States with a correlation coefficient (R) of 0.222 and weighted average of 93.7%. Similarly, the statistical analysis conducted on geographies consisting of 158,727,043 people shows no correlation between the proportion of Immigrants from Bolivia and percentage of population with at least 11th grade education in the United States with a correlation coefficient (R) of 0.022 and weighted average of 91.7%, a difference of 2.2%.
11th Grade Correlation Summary
| Measurement | Celtic | Immigrants from Bolivia |
| Minimum | 83.1% | 77.3% |
| Maximum | 100.0% | 100.0% |
| Range | 16.9% | 22.7% |
| Mean | 94.6% | 92.4% |
| Median | 94.6% | 92.7% |
| Interquartile 25% (IQ1) | 93.2% | 90.3% |
| Interquartile 75% (IQ3) | 97.2% | 94.8% |
| Interquartile Range (IQR) | 4.0% | 4.5% |
| Standard Deviation (Sample) | 4.0% | 4.0% |
| Standard Deviation (Population) | 3.9% | 3.9% |
Similar Demographics by 11th Grade
Demographics Similar to Celtics by 11th Grade
In terms of 11th grade, the demographic groups most similar to Celtics are Aleut (93.7%, a difference of 0.0%), Soviet Union (93.7%, a difference of 0.010%), Immigrants from Denmark (93.7%, a difference of 0.010%), Immigrants from Latvia (93.8%, a difference of 0.030%), and Canadian (93.7%, a difference of 0.030%).
| Demographics | Rating | Rank | 11th Grade |
| Scotch-Irish | 99.8 /100 | #69 | Exceptional 93.9% |
| Immigrants | England | 99.7 /100 | #70 | Exceptional 93.8% |
| Immigrants | South Africa | 99.7 /100 | #71 | Exceptional 93.8% |
| Immigrants | Japan | 99.7 /100 | #72 | Exceptional 93.8% |
| Romanians | 99.6 /100 | #73 | Exceptional 93.8% |
| Immigrants | Czechoslovakia | 99.6 /100 | #74 | Exceptional 93.8% |
| Immigrants | Latvia | 99.6 /100 | #75 | Exceptional 93.8% |
| Celtics | 99.5 /100 | #76 | Exceptional 93.7% |
| Aleuts | 99.5 /100 | #77 | Exceptional 93.7% |
| Soviet Union | 99.5 /100 | #78 | Exceptional 93.7% |
| Immigrants | Denmark | 99.5 /100 | #79 | Exceptional 93.7% |
| Canadians | 99.5 /100 | #80 | Exceptional 93.7% |
| Immigrants | Moldova | 99.5 /100 | #81 | Exceptional 93.7% |
| Immigrants | Saudi Arabia | 99.3 /100 | #82 | Exceptional 93.7% |
| Icelanders | 99.3 /100 | #83 | Exceptional 93.6% |
Demographics Similar to Immigrants from Bolivia by 11th Grade
In terms of 11th grade, the demographic groups most similar to Immigrants from Bolivia are Subsaharan African (91.7%, a difference of 0.0%), Colombian (91.7%, a difference of 0.0%), Armenian (91.7%, a difference of 0.010%), Comanche (91.7%, a difference of 0.020%), and Hopi (91.7%, a difference of 0.030%).
| Demographics | Rating | Rank | 11th Grade |
| Immigrants | Afghanistan | 3.9 /100 | #230 | Tragic 91.8% |
| Choctaw | 3.7 /100 | #231 | Tragic 91.8% |
| Uruguayans | 3.5 /100 | #232 | Tragic 91.8% |
| Cheyenne | 3.3 /100 | #233 | Tragic 91.8% |
| Armenians | 2.9 /100 | #234 | Tragic 91.7% |
| Sub-Saharan Africans | 2.9 /100 | #235 | Tragic 91.7% |
| Colombians | 2.8 /100 | #236 | Tragic 91.7% |
| Immigrants | Bolivia | 2.8 /100 | #237 | Tragic 91.7% |
| Comanche | 2.6 /100 | #238 | Tragic 91.7% |
| Hopi | 2.5 /100 | #239 | Tragic 91.7% |
| South Americans | 2.0 /100 | #240 | Tragic 91.6% |
| Bahamians | 1.8 /100 | #241 | Tragic 91.6% |
| Immigrants | Middle Africa | 1.6 /100 | #242 | Tragic 91.6% |
| Immigrants | Thailand | 1.4 /100 | #243 | Tragic 91.6% |
| Senegalese | 1.4 /100 | #244 | Tragic 91.6% |