Celtic vs Belgian Doctorate Degree
COMPARE
Celtic
Belgian
Doctorate Degree
Doctorate Degree Comparison
Celtics
Belgians
1.9%
DOCTORATE DEGREE
66.7/ 100
METRIC RATING
164th/ 347
METRIC RANK
1.8%
DOCTORATE DEGREE
50.3/ 100
METRIC RATING
172nd/ 347
METRIC RANK
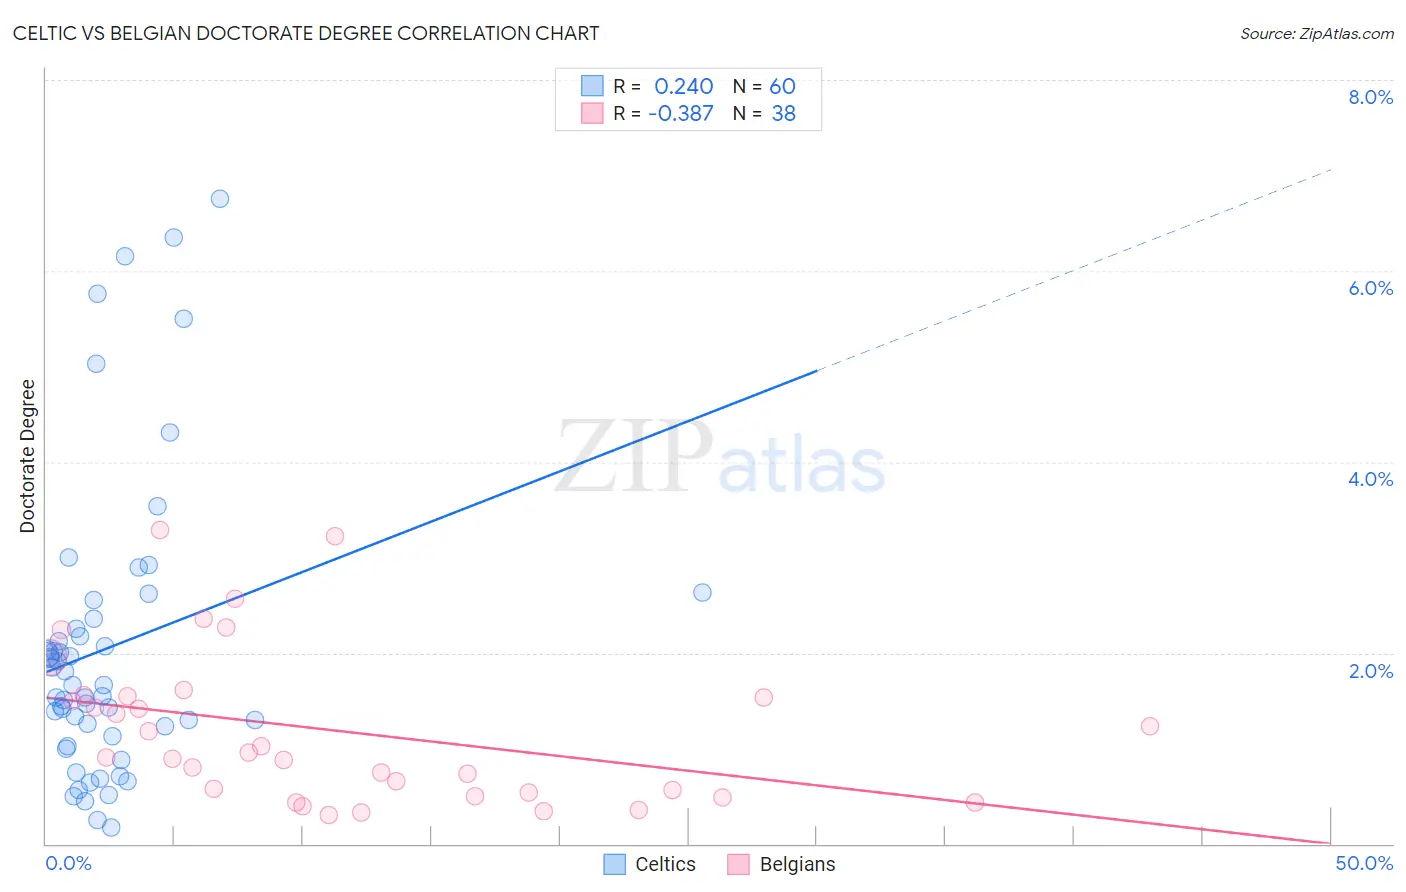
Celtic vs Belgian Doctorate Degree Correlation Chart
The statistical analysis conducted on geographies consisting of 167,913,023 people shows a weak positive correlation between the proportion of Celtics and percentage of population with at least doctorate degree education in the United States with a correlation coefficient (R) of 0.240 and weighted average of 1.9%. Similarly, the statistical analysis conducted on geographies consisting of 351,946,706 people shows a mild negative correlation between the proportion of Belgians and percentage of population with at least doctorate degree education in the United States with a correlation coefficient (R) of -0.387 and weighted average of 1.8%, a difference of 2.5%.
Doctorate Degree Correlation Summary
| Measurement | Celtic | Belgian |
| Minimum | 0.17% | 0.30% |
| Maximum | 6.8% | 3.3% |
| Range | 6.6% | 3.0% |
| Mean | 2.1% | 1.2% |
| Median | 1.7% | 0.93% |
| Interquartile 25% (IQ1) | 1.2% | 0.53% |
| Interquartile 75% (IQ3) | 2.3% | 1.5% |
| Interquartile Range (IQR) | 1.1% | 1.0% |
| Standard Deviation (Sample) | 1.5% | 0.80% |
| Standard Deviation (Population) | 1.5% | 0.79% |
Demographics Similar to Celtics and Belgians by Doctorate Degree
In terms of doctorate degree, the demographic groups most similar to Celtics are Czech (1.9%, a difference of 0.10%), Irish (1.9%, a difference of 0.13%), Immigrants from Middle Africa (1.9%, a difference of 0.35%), Scotch-Irish (1.9%, a difference of 0.49%), and Welsh (1.9%, a difference of 0.50%). Similarly, the demographic groups most similar to Belgians are Norwegian (1.8%, a difference of 0.040%), Immigrants from Bangladesh (1.8%, a difference of 0.040%), Immigrants from Thailand (1.8%, a difference of 0.12%), Spanish (1.8%, a difference of 0.14%), and Iraqi (1.8%, a difference of 0.15%).
| Demographics | Rating | Rank | Doctorate Degree |
| Hungarians | 71.7 /100 | #158 | Good 1.9% |
| Slovenes | 70.2 /100 | #159 | Good 1.9% |
| Welsh | 69.7 /100 | #160 | Good 1.9% |
| Immigrants | Middle Africa | 68.8 /100 | #161 | Good 1.9% |
| Irish | 67.5 /100 | #162 | Good 1.9% |
| Czechs | 67.3 /100 | #163 | Good 1.9% |
| Celtics | 66.7 /100 | #164 | Good 1.9% |
| Scotch-Irish | 63.6 /100 | #165 | Good 1.9% |
| Spaniards | 63.5 /100 | #166 | Good 1.9% |
| Macedonians | 60.9 /100 | #167 | Good 1.9% |
| Sri Lankans | 60.3 /100 | #168 | Good 1.9% |
| Vietnamese | 54.8 /100 | #169 | Average 1.9% |
| Costa Ricans | 53.3 /100 | #170 | Average 1.8% |
| Bermudans | 52.1 /100 | #171 | Average 1.8% |
| Belgians | 50.3 /100 | #172 | Average 1.8% |
| Norwegians | 50.0 /100 | #173 | Average 1.8% |
| Immigrants | Bangladesh | 50.0 /100 | #174 | Average 1.8% |
| Immigrants | Thailand | 49.4 /100 | #175 | Average 1.8% |
| Spanish | 49.3 /100 | #176 | Average 1.8% |
| Iraqis | 49.2 /100 | #177 | Average 1.8% |
| French | 48.8 /100 | #178 | Average 1.8% |