Cape Verdean vs Immigrants from Ecuador Bachelor's Degree
COMPARE
Cape Verdean
Immigrants from Ecuador
Bachelor's Degree
Bachelor's Degree Comparison
Cape Verdeans
Immigrants from Ecuador
30.9%
BACHELOR'S DEGREE
0.1/ 100
METRIC RATING
293rd/ 347
METRIC RANK
34.7%
BACHELOR'S DEGREE
3.3/ 100
METRIC RATING
233rd/ 347
METRIC RANK
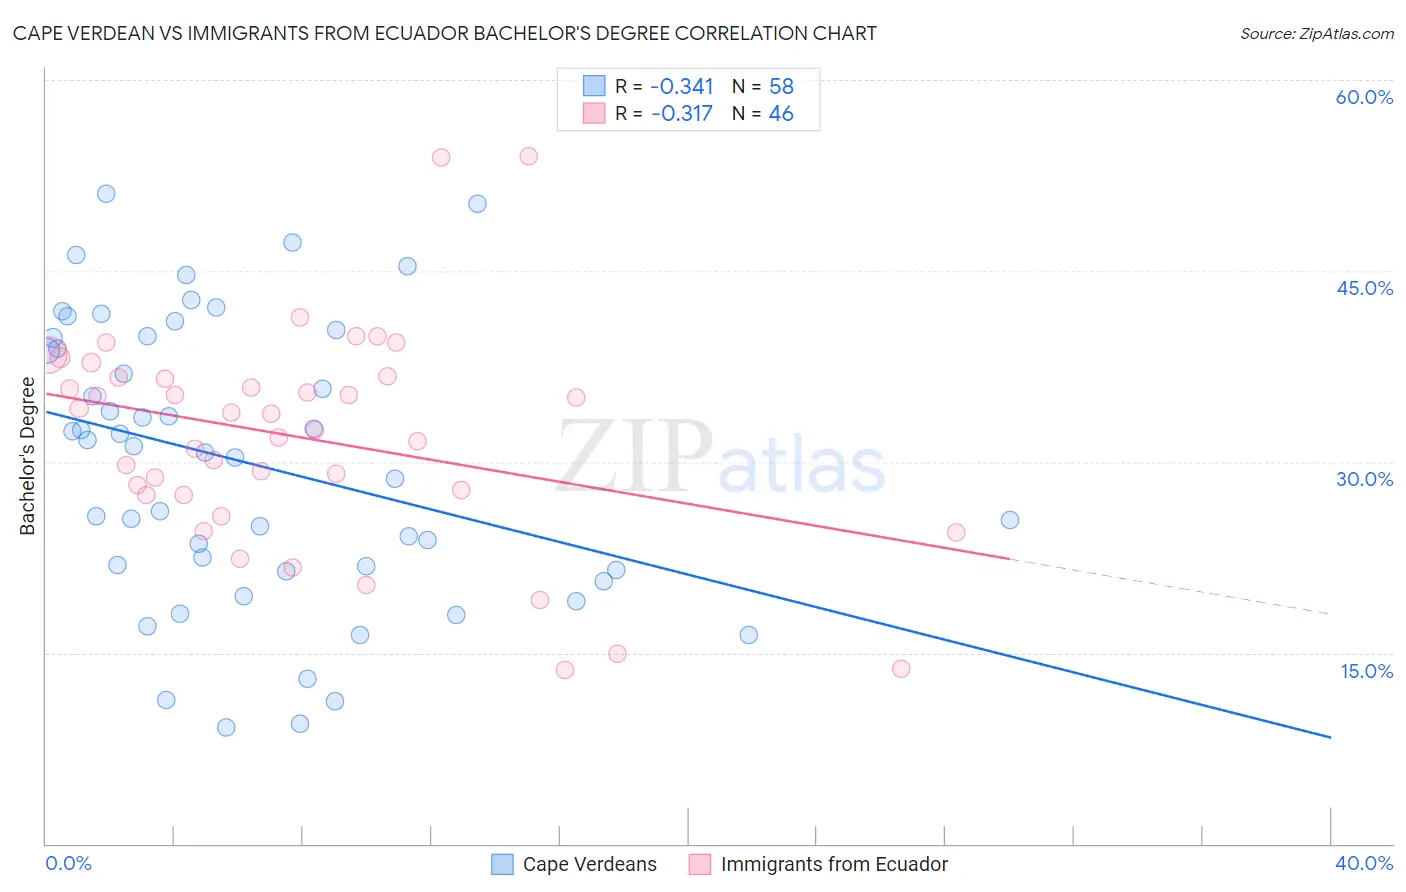
Cape Verdean vs Immigrants from Ecuador Bachelor's Degree Correlation Chart
The statistical analysis conducted on geographies consisting of 107,579,192 people shows a mild negative correlation between the proportion of Cape Verdeans and percentage of population with at least bachelor's degree education in the United States with a correlation coefficient (R) of -0.341 and weighted average of 30.9%. Similarly, the statistical analysis conducted on geographies consisting of 271,013,109 people shows a mild negative correlation between the proportion of Immigrants from Ecuador and percentage of population with at least bachelor's degree education in the United States with a correlation coefficient (R) of -0.317 and weighted average of 34.7%, a difference of 12.4%.
Bachelor's Degree Correlation Summary
| Measurement | Cape Verdean | Immigrants from Ecuador |
| Minimum | 9.1% | 13.7% |
| Maximum | 51.0% | 54.0% |
| Range | 41.9% | 40.4% |
| Mean | 29.9% | 31.9% |
| Median | 31.0% | 33.1% |
| Interquartile 25% (IQ1) | 21.5% | 27.4% |
| Interquartile 75% (IQ3) | 39.7% | 36.6% |
| Interquartile Range (IQR) | 18.2% | 9.3% |
| Standard Deviation (Sample) | 11.0% | 8.5% |
| Standard Deviation (Population) | 10.9% | 8.4% |
Similar Demographics by Bachelor's Degree
Demographics Similar to Cape Verdeans by Bachelor's Degree
In terms of bachelor's degree, the demographic groups most similar to Cape Verdeans are Ute (30.9%, a difference of 0.090%), Black/African American (30.9%, a difference of 0.18%), Immigrants from Honduras (30.9%, a difference of 0.21%), Puerto Rican (31.0%, a difference of 0.26%), and Guatemalan (31.0%, a difference of 0.40%).
| Demographics | Rating | Rank | Bachelor's Degree |
| Immigrants | El Salvador | 0.1 /100 | #286 | Tragic 31.3% |
| Ottawa | 0.1 /100 | #287 | Tragic 31.1% |
| Guatemalans | 0.1 /100 | #288 | Tragic 31.0% |
| Puerto Ricans | 0.1 /100 | #289 | Tragic 31.0% |
| Immigrants | Honduras | 0.1 /100 | #290 | Tragic 30.9% |
| Blacks/African Americans | 0.1 /100 | #291 | Tragic 30.9% |
| Ute | 0.1 /100 | #292 | Tragic 30.9% |
| Cape Verdeans | 0.1 /100 | #293 | Tragic 30.9% |
| Immigrants | Guatemala | 0.0 /100 | #294 | Tragic 30.8% |
| Immigrants | Dominican Republic | 0.0 /100 | #295 | Tragic 30.7% |
| Puget Sound Salish | 0.0 /100 | #296 | Tragic 30.7% |
| Immigrants | Haiti | 0.0 /100 | #297 | Tragic 30.6% |
| Chippewa | 0.0 /100 | #298 | Tragic 30.6% |
| Chickasaw | 0.0 /100 | #299 | Tragic 30.4% |
| Immigrants | Micronesia | 0.0 /100 | #300 | Tragic 30.4% |
Demographics Similar to Immigrants from Ecuador by Bachelor's Degree
In terms of bachelor's degree, the demographic groups most similar to Immigrants from Ecuador are Hmong (34.8%, a difference of 0.11%), Guamanian/Chamorro (34.6%, a difference of 0.22%), Immigrants from West Indies (34.6%, a difference of 0.31%), Liberian (34.6%, a difference of 0.42%), and Tlingit-Haida (34.6%, a difference of 0.45%).
| Demographics | Rating | Rank | Bachelor's Degree |
| Portuguese | 7.2 /100 | #226 | Tragic 35.5% |
| Ecuadorians | 6.6 /100 | #227 | Tragic 35.4% |
| Immigrants | Trinidad and Tobago | 6.0 /100 | #228 | Tragic 35.3% |
| Whites/Caucasians | 5.9 /100 | #229 | Tragic 35.3% |
| Immigrants | Grenada | 4.3 /100 | #230 | Tragic 35.0% |
| Immigrants | St. Vincent and the Grenadines | 4.3 /100 | #231 | Tragic 35.0% |
| Hmong | 3.4 /100 | #232 | Tragic 34.8% |
| Immigrants | Ecuador | 3.3 /100 | #233 | Tragic 34.7% |
| Guamanians/Chamorros | 3.0 /100 | #234 | Tragic 34.6% |
| Immigrants | West Indies | 2.9 /100 | #235 | Tragic 34.6% |
| Liberians | 2.8 /100 | #236 | Tragic 34.6% |
| Tlingit-Haida | 2.8 /100 | #237 | Tragic 34.6% |
| Guyanese | 2.5 /100 | #238 | Tragic 34.5% |
| British West Indians | 2.5 /100 | #239 | Tragic 34.5% |
| Tongans | 2.0 /100 | #240 | Tragic 34.3% |