Cambodian vs Sri Lankan Associate's Degree
COMPARE
Cambodian
Sri Lankan
Associate's Degree
Associate's Degree Comparison
Cambodians
Sri Lankans
54.6%
ASSOCIATE'S DEGREE
100.0/ 100
METRIC RATING
20th/ 347
METRIC RANK
46.3%
ASSOCIATE'S DEGREE
47.6/ 100
METRIC RATING
179th/ 347
METRIC RANK
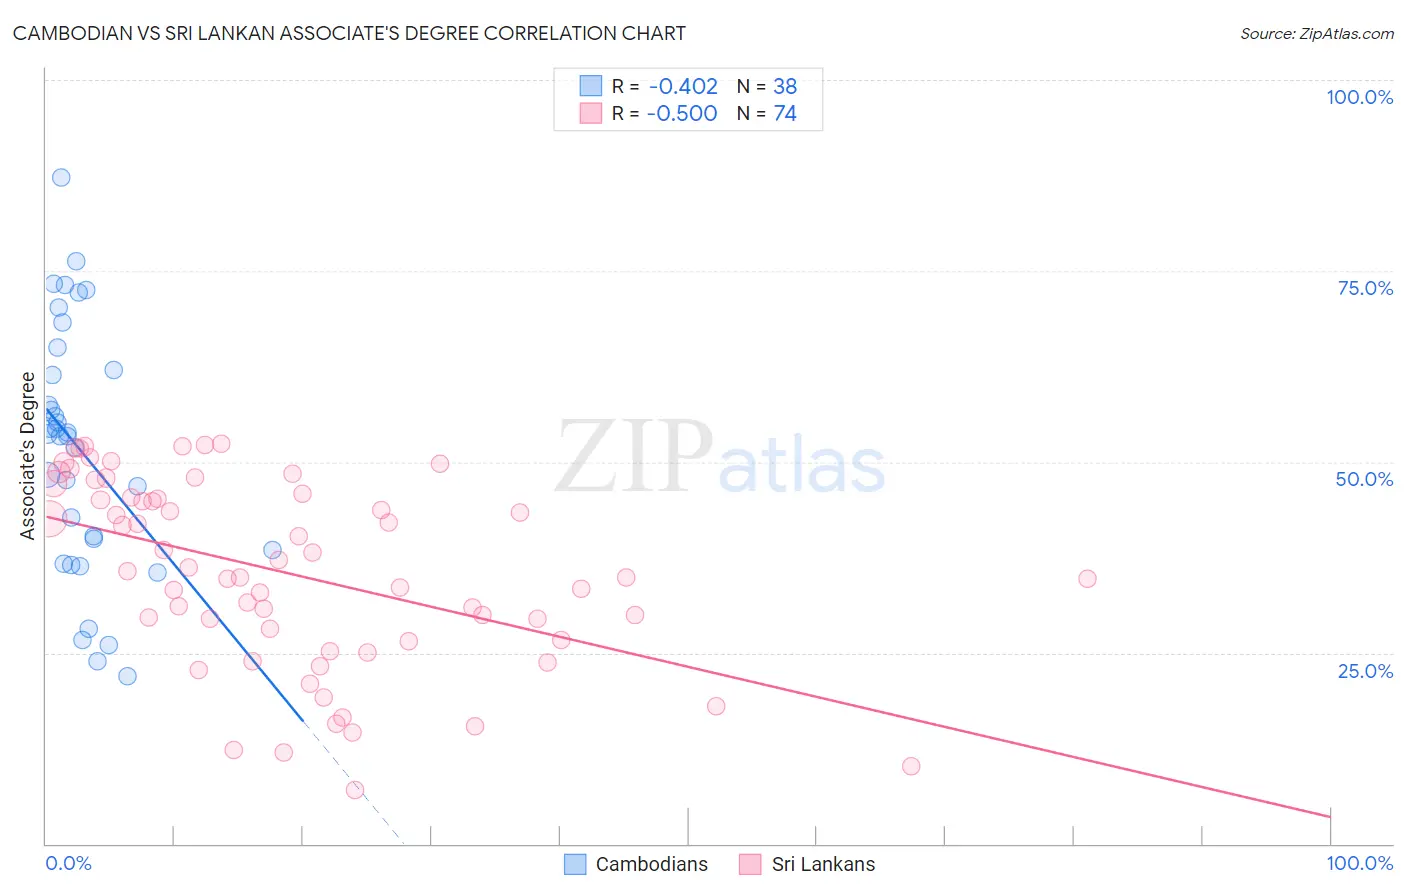
Cambodian vs Sri Lankan Associate's Degree Correlation Chart
The statistical analysis conducted on geographies consisting of 102,512,775 people shows a moderate negative correlation between the proportion of Cambodians and percentage of population with at least associate's degree education in the United States with a correlation coefficient (R) of -0.402 and weighted average of 54.6%. Similarly, the statistical analysis conducted on geographies consisting of 440,543,286 people shows a substantial negative correlation between the proportion of Sri Lankans and percentage of population with at least associate's degree education in the United States with a correlation coefficient (R) of -0.500 and weighted average of 46.3%, a difference of 18.1%.
Associate's Degree Correlation Summary
| Measurement | Cambodian | Sri Lankan |
| Minimum | 21.9% | 7.0% |
| Maximum | 87.2% | 52.3% |
| Range | 65.4% | 45.3% |
| Mean | 51.5% | 35.4% |
| Median | 53.5% | 35.3% |
| Interquartile 25% (IQ1) | 38.4% | 26.6% |
| Interquartile 75% (IQ3) | 62.1% | 45.3% |
| Interquartile Range (IQR) | 23.7% | 18.7% |
| Standard Deviation (Sample) | 16.3% | 12.2% |
| Standard Deviation (Population) | 16.1% | 12.1% |
Similar Demographics by Associate's Degree
Demographics Similar to Cambodians by Associate's Degree
In terms of associate's degree, the demographic groups most similar to Cambodians are Immigrants from Ireland (54.7%, a difference of 0.020%), Immigrants from Sweden (54.6%, a difference of 0.060%), Immigrants from Japan (54.6%, a difference of 0.10%), Burmese (54.6%, a difference of 0.10%), and Immigrants from Korea (54.5%, a difference of 0.19%).
| Demographics | Rating | Rank | Associate's Degree |
| Immigrants | China | 100.0 /100 | #13 | Exceptional 55.5% |
| Immigrants | Hong Kong | 100.0 /100 | #14 | Exceptional 55.4% |
| Immigrants | Eastern Asia | 100.0 /100 | #15 | Exceptional 55.4% |
| Soviet Union | 100.0 /100 | #16 | Exceptional 55.1% |
| Eastern Europeans | 100.0 /100 | #17 | Exceptional 55.0% |
| Indians (Asian) | 100.0 /100 | #18 | Exceptional 54.8% |
| Immigrants | Ireland | 100.0 /100 | #19 | Exceptional 54.7% |
| Cambodians | 100.0 /100 | #20 | Exceptional 54.6% |
| Immigrants | Sweden | 100.0 /100 | #21 | Exceptional 54.6% |
| Immigrants | Japan | 100.0 /100 | #22 | Exceptional 54.6% |
| Burmese | 100.0 /100 | #23 | Exceptional 54.6% |
| Immigrants | Korea | 100.0 /100 | #24 | Exceptional 54.5% |
| Immigrants | Switzerland | 100.0 /100 | #25 | Exceptional 54.5% |
| Immigrants | Belgium | 100.0 /100 | #26 | Exceptional 54.5% |
| Latvians | 100.0 /100 | #27 | Exceptional 53.9% |
Demographics Similar to Sri Lankans by Associate's Degree
In terms of associate's degree, the demographic groups most similar to Sri Lankans are Immigrants from Bosnia and Herzegovina (46.3%, a difference of 0.050%), Slovak (46.3%, a difference of 0.060%), Finnish (46.3%, a difference of 0.070%), Bermudan (46.2%, a difference of 0.090%), and Belgian (46.3%, a difference of 0.10%).
| Demographics | Rating | Rank | Associate's Degree |
| Peruvians | 50.5 /100 | #172 | Average 46.4% |
| Immigrants | Iraq | 50.3 /100 | #173 | Average 46.4% |
| English | 50.0 /100 | #174 | Average 46.4% |
| Belgians | 48.9 /100 | #175 | Average 46.3% |
| Finns | 48.5 /100 | #176 | Average 46.3% |
| Slovaks | 48.4 /100 | #177 | Average 46.3% |
| Immigrants | Bosnia and Herzegovina | 48.3 /100 | #178 | Average 46.3% |
| Sri Lankans | 47.6 /100 | #179 | Average 46.3% |
| Bermudans | 46.4 /100 | #180 | Average 46.2% |
| Immigrants | Colombia | 41.3 /100 | #181 | Average 46.0% |
| Swiss | 40.4 /100 | #182 | Average 46.0% |
| Yugoslavians | 40.2 /100 | #183 | Average 46.0% |
| Czechoslovakians | 40.0 /100 | #184 | Average 46.0% |
| Costa Ricans | 38.6 /100 | #185 | Fair 46.0% |
| Welsh | 37.9 /100 | #186 | Fair 45.9% |