Cambodian vs Korean Bachelor's Degree
COMPARE
Cambodian
Korean
Bachelor's Degree
Bachelor's Degree Comparison
Cambodians
Koreans
47.2%
BACHELOR'S DEGREE
100.0/ 100
METRIC RATING
19th/ 347
METRIC RANK
37.0%
BACHELOR'S DEGREE
29.8/ 100
METRIC RATING
195th/ 347
METRIC RANK
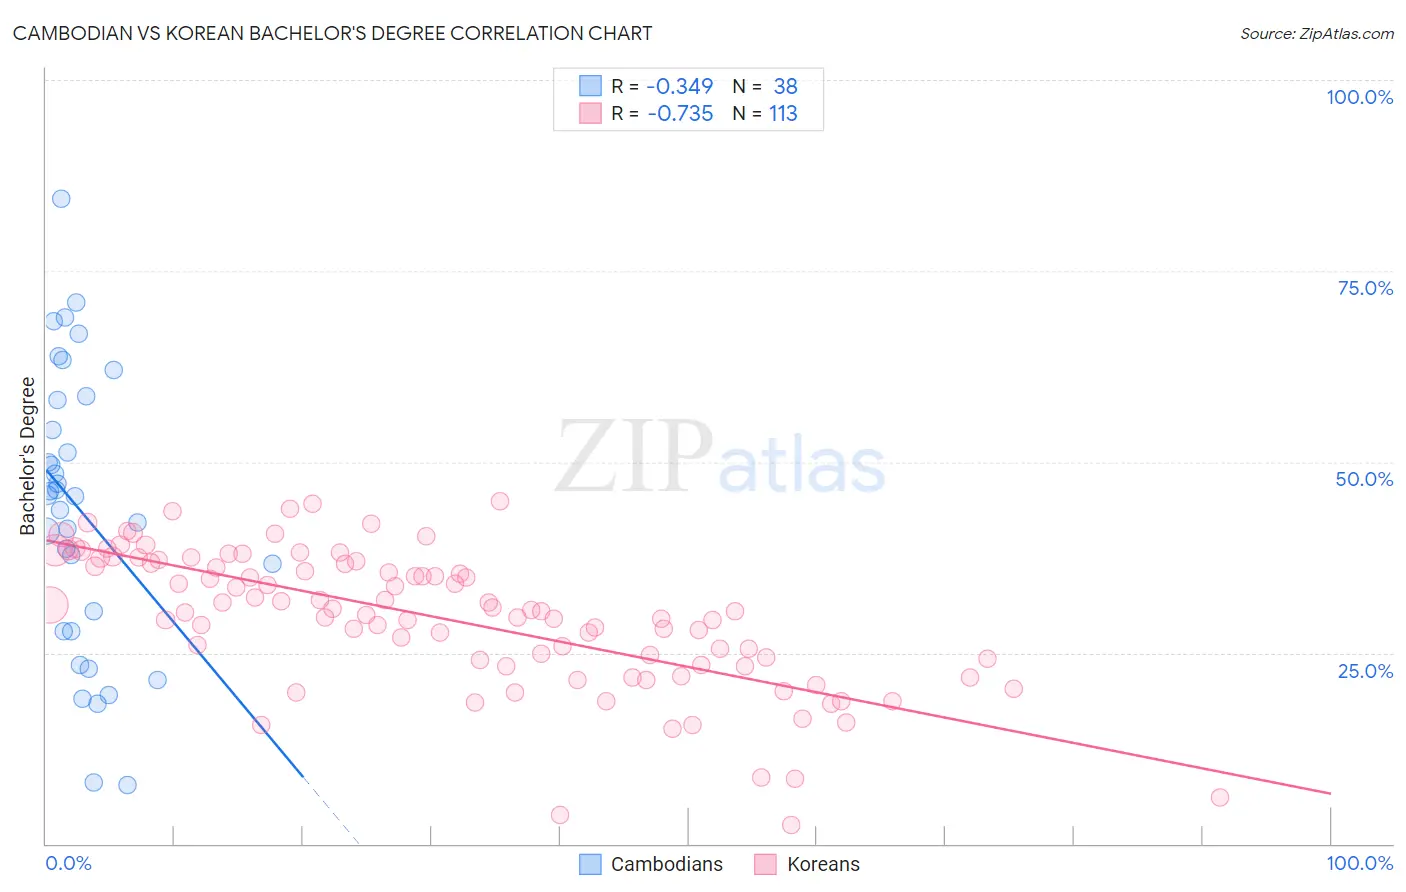
Cambodian vs Korean Bachelor's Degree Correlation Chart
The statistical analysis conducted on geographies consisting of 102,512,775 people shows a mild negative correlation between the proportion of Cambodians and percentage of population with at least bachelor's degree education in the United States with a correlation coefficient (R) of -0.349 and weighted average of 47.2%. Similarly, the statistical analysis conducted on geographies consisting of 510,872,242 people shows a strong negative correlation between the proportion of Koreans and percentage of population with at least bachelor's degree education in the United States with a correlation coefficient (R) of -0.735 and weighted average of 37.0%, a difference of 27.6%.
Bachelor's Degree Correlation Summary
| Measurement | Cambodian | Korean |
| Minimum | 7.6% | 2.5% |
| Maximum | 84.4% | 44.8% |
| Range | 76.8% | 42.3% |
| Mean | 43.6% | 29.6% |
| Median | 45.6% | 30.4% |
| Interquartile 25% (IQ1) | 27.8% | 23.7% |
| Interquartile 75% (IQ3) | 58.1% | 36.9% |
| Interquartile Range (IQR) | 30.3% | 13.2% |
| Standard Deviation (Sample) | 18.4% | 9.0% |
| Standard Deviation (Population) | 18.2% | 9.0% |
Similar Demographics by Bachelor's Degree
Demographics Similar to Cambodians by Bachelor's Degree
In terms of bachelor's degree, the demographic groups most similar to Cambodians are Immigrants from Switzerland (47.1%, a difference of 0.22%), Immigrants from Ireland (47.1%, a difference of 0.23%), Indian (Asian) (47.4%, a difference of 0.43%), Immigrants from Belgium (47.0%, a difference of 0.43%), and Immigrants from Sweden (47.0%, a difference of 0.52%).
| Demographics | Rating | Rank | Bachelor's Degree |
| Immigrants | China | 100.0 /100 | #12 | Exceptional 48.4% |
| Immigrants | South Central Asia | 100.0 /100 | #13 | Exceptional 48.3% |
| Immigrants | Hong Kong | 100.0 /100 | #14 | Exceptional 48.2% |
| Immigrants | Eastern Asia | 100.0 /100 | #15 | Exceptional 48.1% |
| Soviet Union | 100.0 /100 | #16 | Exceptional 47.9% |
| Eastern Europeans | 100.0 /100 | #17 | Exceptional 47.5% |
| Indians (Asian) | 100.0 /100 | #18 | Exceptional 47.4% |
| Cambodians | 100.0 /100 | #19 | Exceptional 47.2% |
| Immigrants | Switzerland | 100.0 /100 | #20 | Exceptional 47.1% |
| Immigrants | Ireland | 100.0 /100 | #21 | Exceptional 47.1% |
| Immigrants | Belgium | 100.0 /100 | #22 | Exceptional 47.0% |
| Immigrants | Sweden | 100.0 /100 | #23 | Exceptional 47.0% |
| Immigrants | Korea | 100.0 /100 | #24 | Exceptional 47.0% |
| Burmese | 100.0 /100 | #25 | Exceptional 46.9% |
| Immigrants | Japan | 100.0 /100 | #26 | Exceptional 46.8% |
Demographics Similar to Koreans by Bachelor's Degree
In terms of bachelor's degree, the demographic groups most similar to Koreans are Belgian (37.0%, a difference of 0.010%), Celtic (37.0%, a difference of 0.030%), Czechoslovakian (37.0%, a difference of 0.070%), Welsh (37.0%, a difference of 0.080%), and Yugoslavian (37.1%, a difference of 0.20%).
| Demographics | Rating | Rank | Bachelor's Degree |
| Immigrants | Oceania | 37.3 /100 | #188 | Fair 37.3% |
| Slovaks | 36.9 /100 | #189 | Fair 37.3% |
| Swiss | 34.1 /100 | #190 | Fair 37.2% |
| Nigerians | 33.9 /100 | #191 | Fair 37.2% |
| Immigrants | Vietnam | 32.1 /100 | #192 | Fair 37.1% |
| Yugoslavians | 31.5 /100 | #193 | Fair 37.1% |
| Belgians | 29.9 /100 | #194 | Fair 37.0% |
| Koreans | 29.8 /100 | #195 | Fair 37.0% |
| Celtics | 29.5 /100 | #196 | Fair 37.0% |
| Czechoslovakians | 29.2 /100 | #197 | Fair 37.0% |
| Welsh | 29.1 /100 | #198 | Fair 37.0% |
| Immigrants | Costa Rica | 27.4 /100 | #199 | Fair 36.9% |
| Immigrants | Ghana | 27.4 /100 | #200 | Fair 36.9% |
| Immigrants | South Eastern Asia | 25.4 /100 | #201 | Fair 36.8% |
| Immigrants | Zaire | 25.3 /100 | #202 | Fair 36.8% |