Cambodian vs Immigrants from Ethiopia 11th Grade
COMPARE
Cambodian
Immigrants from Ethiopia
11th Grade
11th Grade Comparison
Cambodians
Immigrants from Ethiopia
93.6%
11TH GRADE
99.2/ 100
METRIC RATING
88th/ 347
METRIC RANK
92.1%
11TH GRADE
13.9/ 100
METRIC RATING
213th/ 347
METRIC RANK
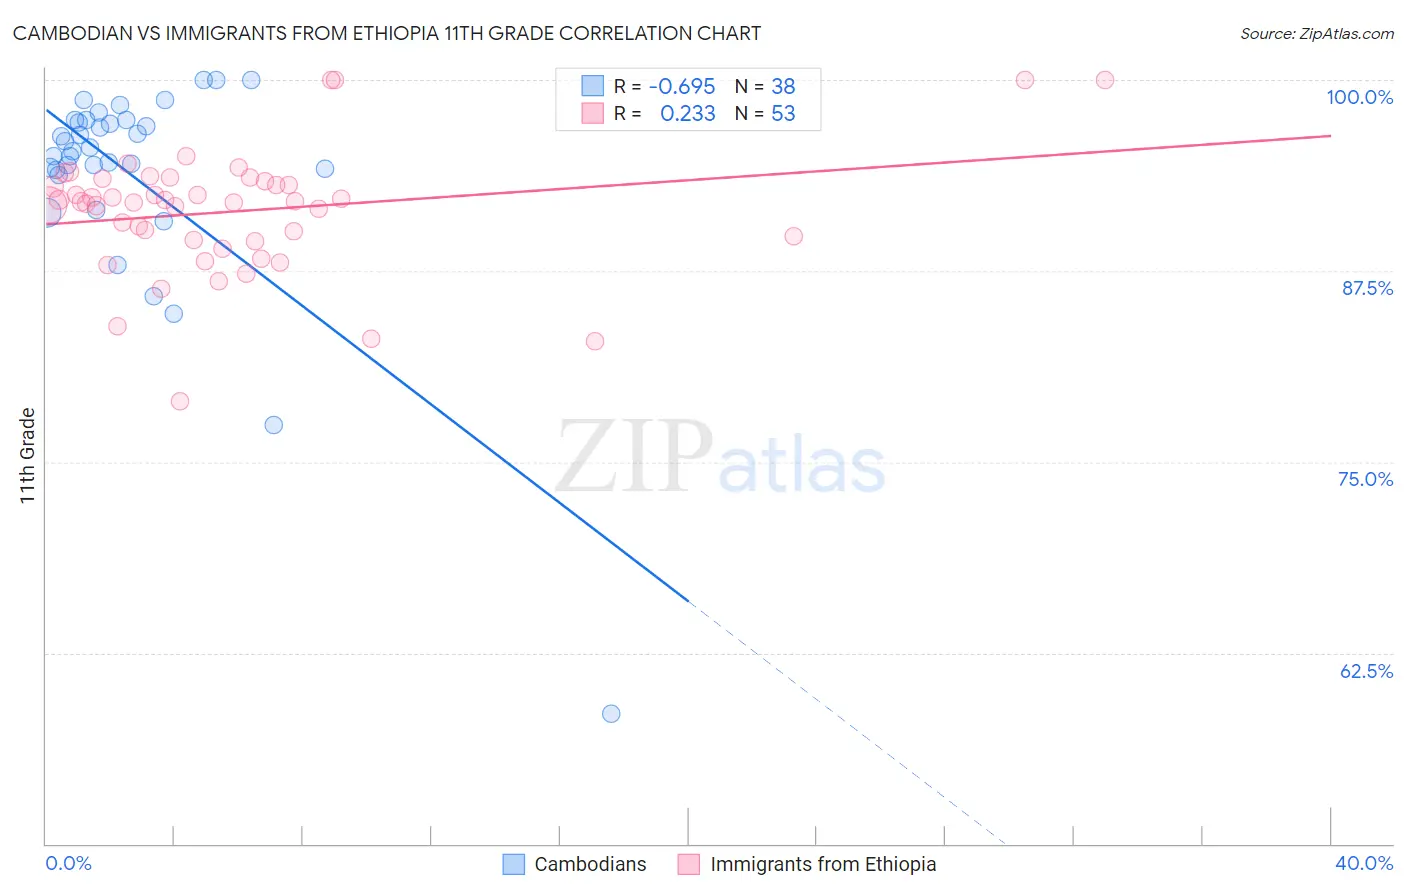
Cambodian vs Immigrants from Ethiopia 11th Grade Correlation Chart
The statistical analysis conducted on geographies consisting of 102,514,976 people shows a significant negative correlation between the proportion of Cambodians and percentage of population with at least 11th grade education in the United States with a correlation coefficient (R) of -0.695 and weighted average of 93.6%. Similarly, the statistical analysis conducted on geographies consisting of 211,528,629 people shows a weak positive correlation between the proportion of Immigrants from Ethiopia and percentage of population with at least 11th grade education in the United States with a correlation coefficient (R) of 0.233 and weighted average of 92.1%, a difference of 1.7%.
11th Grade Correlation Summary
| Measurement | Cambodian | Immigrants from Ethiopia |
| Minimum | 58.5% | 79.0% |
| Maximum | 100.0% | 100.0% |
| Range | 41.5% | 21.0% |
| Mean | 93.7% | 91.4% |
| Median | 95.5% | 92.0% |
| Interquartile 25% (IQ1) | 94.1% | 89.5% |
| Interquartile 75% (IQ3) | 97.4% | 93.5% |
| Interquartile Range (IQR) | 3.3% | 4.0% |
| Standard Deviation (Sample) | 7.4% | 4.1% |
| Standard Deviation (Population) | 7.3% | 4.0% |
Similar Demographics by 11th Grade
Demographics Similar to Cambodians by 11th Grade
In terms of 11th grade, the demographic groups most similar to Cambodians are Immigrants from South Central Asia (93.6%, a difference of 0.0%), Immigrants from Western Europe (93.6%, a difference of 0.0%), Burmese (93.6%, a difference of 0.0%), Immigrants from Switzerland (93.6%, a difference of 0.010%), and Ottawa (93.6%, a difference of 0.010%).
| Demographics | Rating | Rank | 11th Grade |
| Immigrants | Moldova | 99.5 /100 | #81 | Exceptional 93.7% |
| Immigrants | Saudi Arabia | 99.3 /100 | #82 | Exceptional 93.7% |
| Icelanders | 99.3 /100 | #83 | Exceptional 93.6% |
| Immigrants | Taiwan | 99.3 /100 | #84 | Exceptional 93.6% |
| Immigrants | Switzerland | 99.3 /100 | #85 | Exceptional 93.6% |
| Immigrants | South Central Asia | 99.2 /100 | #86 | Exceptional 93.6% |
| Immigrants | Western Europe | 99.2 /100 | #87 | Exceptional 93.6% |
| Cambodians | 99.2 /100 | #88 | Exceptional 93.6% |
| Burmese | 99.2 /100 | #89 | Exceptional 93.6% |
| Ottawa | 99.2 /100 | #90 | Exceptional 93.6% |
| South Africans | 99.2 /100 | #91 | Exceptional 93.6% |
| Immigrants | Bulgaria | 99.1 /100 | #92 | Exceptional 93.6% |
| Puget Sound Salish | 99.1 /100 | #93 | Exceptional 93.6% |
| Swiss | 99.0 /100 | #94 | Exceptional 93.6% |
| Immigrants | France | 99.0 /100 | #95 | Exceptional 93.6% |
Demographics Similar to Immigrants from Ethiopia by 11th Grade
In terms of 11th grade, the demographic groups most similar to Immigrants from Ethiopia are Korean (92.1%, a difference of 0.010%), Afghan (92.1%, a difference of 0.020%), Immigrants from Southern Europe (92.1%, a difference of 0.030%), Somali (92.1%, a difference of 0.050%), and Immigrants from Sierra Leone (92.0%, a difference of 0.060%).
| Demographics | Rating | Rank | 11th Grade |
| Bolivians | 23.2 /100 | #206 | Fair 92.2% |
| Immigrants | Oceania | 22.4 /100 | #207 | Fair 92.2% |
| Colville | 21.8 /100 | #208 | Fair 92.2% |
| Tongans | 19.8 /100 | #209 | Poor 92.2% |
| Ethiopians | 18.8 /100 | #210 | Poor 92.2% |
| Immigrants | Micronesia | 17.7 /100 | #211 | Poor 92.2% |
| Koreans | 14.4 /100 | #212 | Poor 92.1% |
| Immigrants | Ethiopia | 13.9 /100 | #213 | Poor 92.1% |
| Afghans | 12.8 /100 | #214 | Poor 92.1% |
| Immigrants | Southern Europe | 12.5 /100 | #215 | Poor 92.1% |
| Somalis | 11.6 /100 | #216 | Poor 92.1% |
| Immigrants | Sierra Leone | 11.1 /100 | #217 | Poor 92.0% |
| Blackfeet | 10.1 /100 | #218 | Poor 92.0% |
| Portuguese | 10.0 /100 | #219 | Tragic 92.0% |
| South American Indians | 7.6 /100 | #220 | Tragic 92.0% |