Cajun vs Sierra Leonean Doctorate Degree
COMPARE
Cajun
Sierra Leonean
Doctorate Degree
Doctorate Degree Comparison
Cajuns
Sierra Leoneans
1.5%
DOCTORATE DEGREE
0.3/ 100
METRIC RATING
287th/ 347
METRIC RANK
2.0%
DOCTORATE DEGREE
85.1/ 100
METRIC RATING
143rd/ 347
METRIC RANK
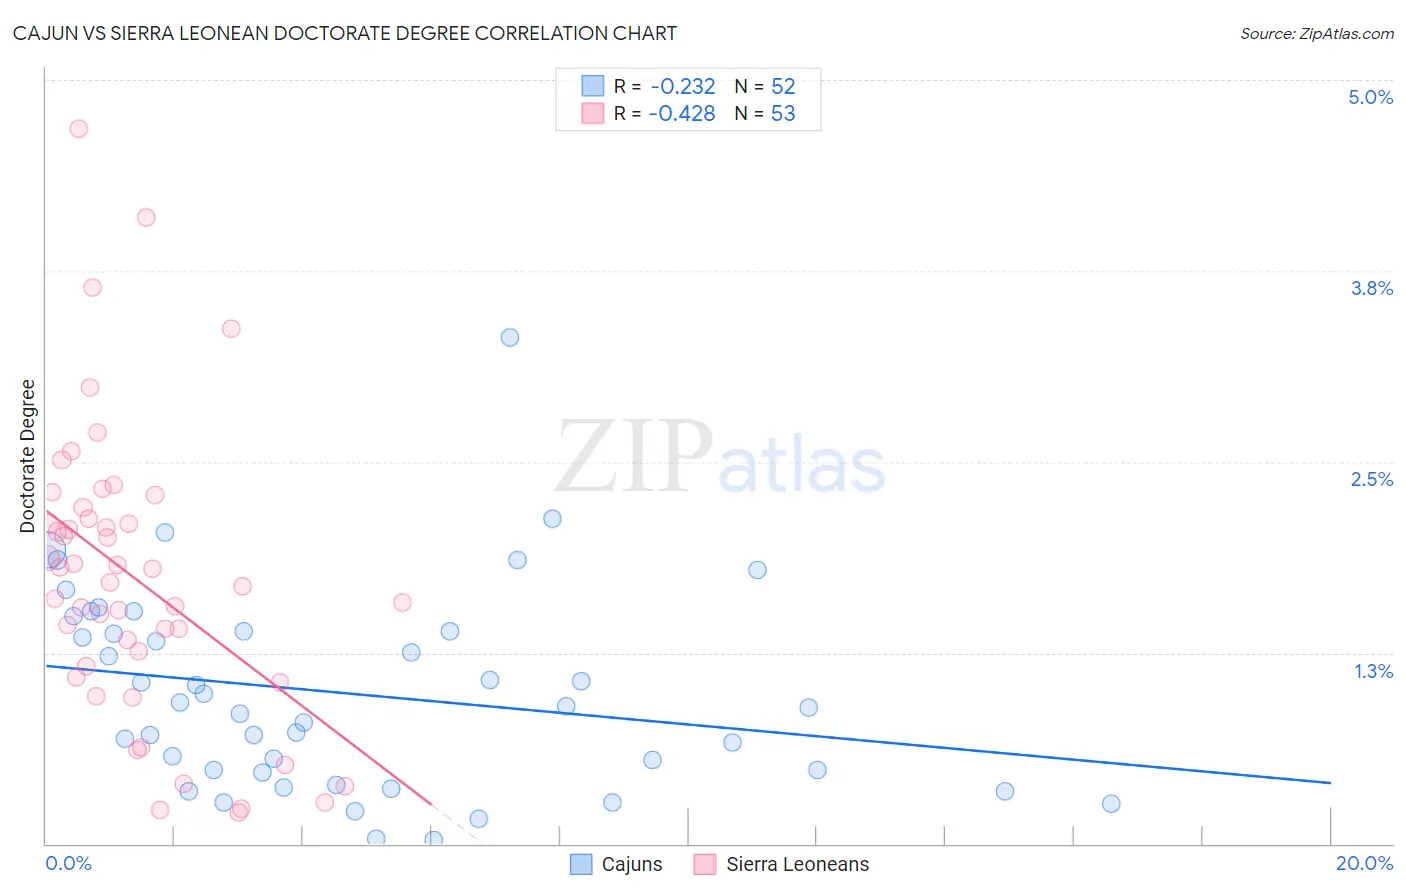
Cajun vs Sierra Leonean Doctorate Degree Correlation Chart
The statistical analysis conducted on geographies consisting of 148,318,310 people shows a weak negative correlation between the proportion of Cajuns and percentage of population with at least doctorate degree education in the United States with a correlation coefficient (R) of -0.232 and weighted average of 1.5%. Similarly, the statistical analysis conducted on geographies consisting of 83,237,718 people shows a moderate negative correlation between the proportion of Sierra Leoneans and percentage of population with at least doctorate degree education in the United States with a correlation coefficient (R) of -0.428 and weighted average of 2.0%, a difference of 34.8%.
Doctorate Degree Correlation Summary
| Measurement | Cajun | Sierra Leonean |
| Minimum | 0.021% | 0.21% |
| Maximum | 3.3% | 4.7% |
| Range | 3.3% | 4.5% |
| Mean | 0.98% | 1.7% |
| Median | 0.90% | 1.7% |
| Interquartile 25% (IQ1) | 0.47% | 1.1% |
| Interquartile 75% (IQ3) | 1.4% | 2.2% |
| Interquartile Range (IQR) | 0.92% | 1.0% |
| Standard Deviation (Sample) | 0.65% | 0.95% |
| Standard Deviation (Population) | 0.65% | 0.94% |
Similar Demographics by Doctorate Degree
Demographics Similar to Cajuns by Doctorate Degree
In terms of doctorate degree, the demographic groups most similar to Cajuns are Cherokee (1.5%, a difference of 0.17%), Immigrants from El Salvador (1.4%, a difference of 0.18%), Cape Verdean (1.4%, a difference of 0.31%), Choctaw (1.4%, a difference of 0.33%), and Malaysian (1.5%, a difference of 0.34%).
| Demographics | Rating | Rank | Doctorate Degree |
| Ecuadorians | 0.4 /100 | #280 | Tragic 1.5% |
| Tohono O'odham | 0.4 /100 | #281 | Tragic 1.5% |
| British West Indians | 0.3 /100 | #282 | Tragic 1.5% |
| Central Americans | 0.3 /100 | #283 | Tragic 1.5% |
| Jamaicans | 0.3 /100 | #284 | Tragic 1.5% |
| Malaysians | 0.3 /100 | #285 | Tragic 1.5% |
| Cherokee | 0.3 /100 | #286 | Tragic 1.5% |
| Cajuns | 0.3 /100 | #287 | Tragic 1.5% |
| Immigrants | El Salvador | 0.3 /100 | #288 | Tragic 1.4% |
| Cape Verdeans | 0.3 /100 | #289 | Tragic 1.4% |
| Choctaw | 0.3 /100 | #290 | Tragic 1.4% |
| Blacks/African Americans | 0.3 /100 | #291 | Tragic 1.4% |
| Alaska Natives | 0.3 /100 | #292 | Tragic 1.4% |
| Immigrants | Yemen | 0.2 /100 | #293 | Tragic 1.4% |
| Samoans | 0.2 /100 | #294 | Tragic 1.4% |
Demographics Similar to Sierra Leoneans by Doctorate Degree
In terms of doctorate degree, the demographic groups most similar to Sierra Leoneans are Immigrants from Moldova (2.0%, a difference of 0.21%), Italian (2.0%, a difference of 0.25%), Kenyan (1.9%, a difference of 0.39%), Immigrants from Syria (1.9%, a difference of 0.41%), and Senegalese (2.0%, a difference of 0.46%).
| Demographics | Rating | Rank | Doctorate Degree |
| Swedes | 88.3 /100 | #136 | Excellent 2.0% |
| South American Indians | 88.3 /100 | #137 | Excellent 2.0% |
| Swiss | 88.0 /100 | #138 | Excellent 2.0% |
| Afghans | 87.2 /100 | #139 | Excellent 2.0% |
| Immigrants | Africa | 87.0 /100 | #140 | Excellent 2.0% |
| Senegalese | 86.7 /100 | #141 | Excellent 2.0% |
| Italians | 86.0 /100 | #142 | Excellent 2.0% |
| Sierra Leoneans | 85.1 /100 | #143 | Excellent 2.0% |
| Immigrants | Moldova | 84.3 /100 | #144 | Excellent 2.0% |
| Kenyans | 83.6 /100 | #145 | Excellent 1.9% |
| Immigrants | Syria | 83.6 /100 | #146 | Excellent 1.9% |
| Immigrants | Senegal | 82.5 /100 | #147 | Excellent 1.9% |
| Luxembourgers | 81.1 /100 | #148 | Excellent 1.9% |
| Basques | 76.9 /100 | #149 | Good 1.9% |
| English | 75.9 /100 | #150 | Good 1.9% |