Cajun vs Arab Bachelor's Degree
COMPARE
Cajun
Arab
Bachelor's Degree
Bachelor's Degree Comparison
Cajuns
Arabs
29.6%
BACHELOR'S DEGREE
0.0/ 100
METRIC RATING
308th/ 347
METRIC RANK
40.9%
BACHELOR'S DEGREE
96.6/ 100
METRIC RATING
109th/ 347
METRIC RANK
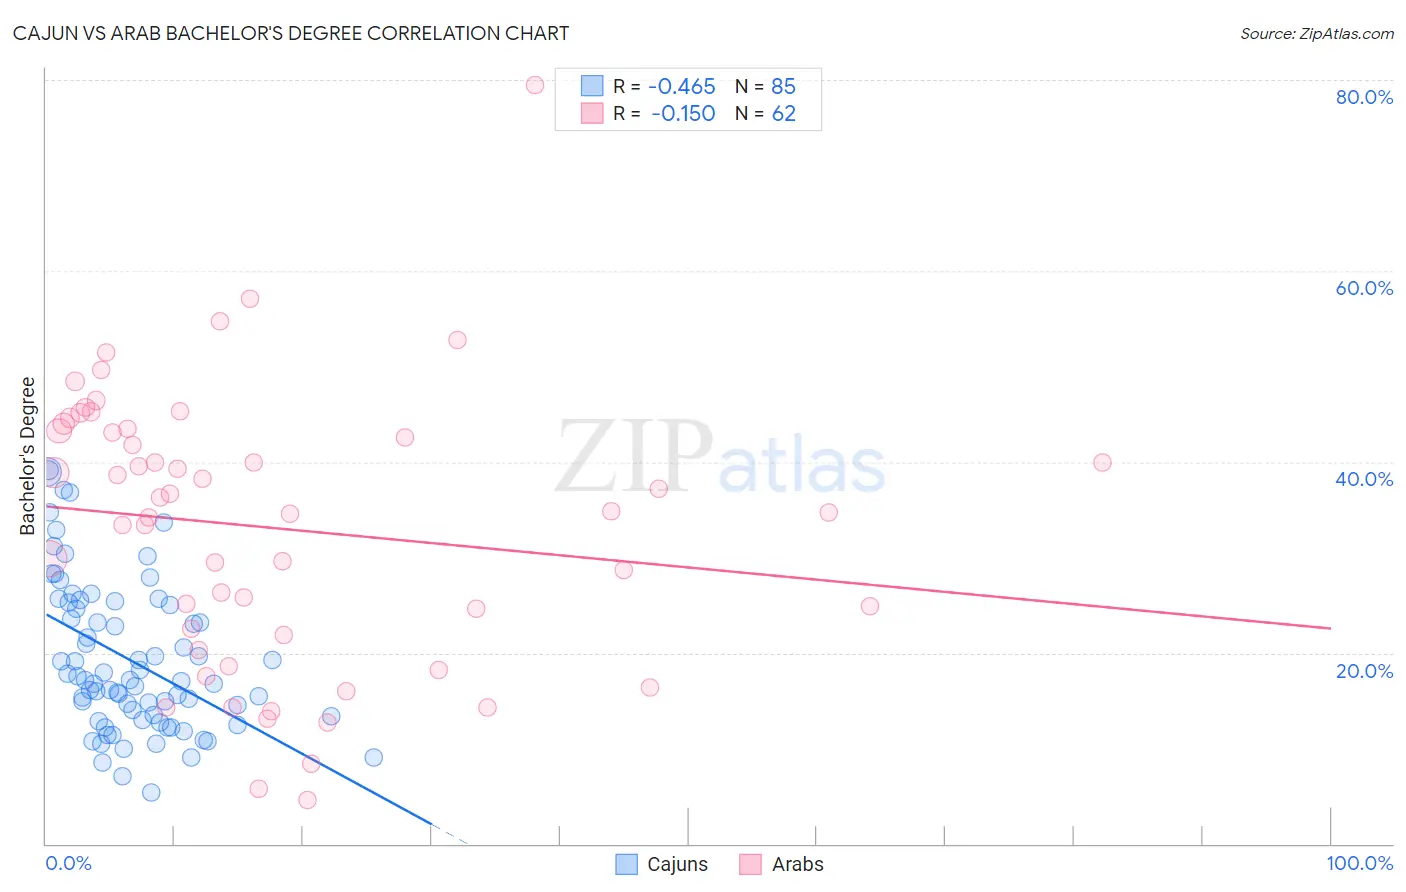
Cajun vs Arab Bachelor's Degree Correlation Chart
The statistical analysis conducted on geographies consisting of 149,707,155 people shows a moderate negative correlation between the proportion of Cajuns and percentage of population with at least bachelor's degree education in the United States with a correlation coefficient (R) of -0.465 and weighted average of 29.6%. Similarly, the statistical analysis conducted on geographies consisting of 486,810,717 people shows a poor negative correlation between the proportion of Arabs and percentage of population with at least bachelor's degree education in the United States with a correlation coefficient (R) of -0.150 and weighted average of 40.9%, a difference of 38.0%.
Bachelor's Degree Correlation Summary
| Measurement | Cajun | Arab |
| Minimum | 5.4% | 4.6% |
| Maximum | 39.1% | 79.5% |
| Range | 33.8% | 74.9% |
| Mean | 19.2% | 33.1% |
| Median | 17.1% | 34.8% |
| Interquartile 25% (IQ1) | 13.2% | 21.9% |
| Interquartile 75% (IQ3) | 25.1% | 43.2% |
| Interquartile Range (IQR) | 11.9% | 21.4% |
| Standard Deviation (Sample) | 7.8% | 14.4% |
| Standard Deviation (Population) | 7.8% | 14.3% |
Similar Demographics by Bachelor's Degree
Demographics Similar to Cajuns by Bachelor's Degree
In terms of bachelor's degree, the demographic groups most similar to Cajuns are Hispanic or Latino (29.6%, a difference of 0.18%), Cheyenne (29.4%, a difference of 0.65%), Choctaw (29.4%, a difference of 0.72%), Seminole (29.4%, a difference of 0.78%), and Nepalese (29.9%, a difference of 0.86%).
| Demographics | Rating | Rank | Bachelor's Degree |
| Immigrants | Cuba | 0.0 /100 | #301 | Tragic 30.3% |
| Mexican American Indians | 0.0 /100 | #302 | Tragic 30.2% |
| Bangladeshis | 0.0 /100 | #303 | Tragic 30.2% |
| Cherokee | 0.0 /100 | #304 | Tragic 30.2% |
| Immigrants | Latin America | 0.0 /100 | #305 | Tragic 30.1% |
| Immigrants | Yemen | 0.0 /100 | #306 | Tragic 29.9% |
| Nepalese | 0.0 /100 | #307 | Tragic 29.9% |
| Cajuns | 0.0 /100 | #308 | Tragic 29.6% |
| Hispanics or Latinos | 0.0 /100 | #309 | Tragic 29.6% |
| Cheyenne | 0.0 /100 | #310 | Tragic 29.4% |
| Choctaw | 0.0 /100 | #311 | Tragic 29.4% |
| Seminole | 0.0 /100 | #312 | Tragic 29.4% |
| Alaska Natives | 0.0 /100 | #313 | Tragic 29.4% |
| Shoshone | 0.0 /100 | #314 | Tragic 29.3% |
| Immigrants | Cabo Verde | 0.0 /100 | #315 | Tragic 29.2% |
Demographics Similar to Arabs by Bachelor's Degree
In terms of bachelor's degree, the demographic groups most similar to Arabs are Ukrainian (40.9%, a difference of 0.020%), Albanian (40.9%, a difference of 0.080%), Immigrants from Chile (40.8%, a difference of 0.12%), Northern European (41.0%, a difference of 0.16%), and Ugandan (40.8%, a difference of 0.17%).
| Demographics | Rating | Rank | Bachelor's Degree |
| Immigrants | Italy | 97.8 /100 | #102 | Exceptional 41.3% |
| Chileans | 97.5 /100 | #103 | Exceptional 41.2% |
| Jordanians | 97.4 /100 | #104 | Exceptional 41.2% |
| Syrians | 97.4 /100 | #105 | Exceptional 41.1% |
| Alsatians | 97.0 /100 | #106 | Exceptional 41.0% |
| Northern Europeans | 96.8 /100 | #107 | Exceptional 41.0% |
| Ukrainians | 96.6 /100 | #108 | Exceptional 40.9% |
| Arabs | 96.6 /100 | #109 | Exceptional 40.9% |
| Albanians | 96.5 /100 | #110 | Exceptional 40.9% |
| Immigrants | Chile | 96.4 /100 | #111 | Exceptional 40.8% |
| Ugandans | 96.3 /100 | #112 | Exceptional 40.8% |
| Brazilians | 96.3 /100 | #113 | Exceptional 40.8% |
| Afghans | 96.2 /100 | #114 | Exceptional 40.8% |
| Palestinians | 95.8 /100 | #115 | Exceptional 40.7% |
| Immigrants | Uganda | 95.7 /100 | #116 | Exceptional 40.7% |