Burmese vs Romanian Bachelor's Degree

COMPARE

Burmese
Race
Ancestry
AfghanAfricanAlaska NativeAlaskan AthabascanAlbanianAleutAlsatianAmericanApacheArabArapahoArgentineanArmenianAssyrian/Chaldean/SyriacAustralianAustrianBahamianBangladeshiBarbadianBasqueBelgianBelizeanBermudanBhutaneseBlackfeetBolivianBrazilianBritishBritish West IndianBulgarianBurmeseCajunCambodianCanadianCape VerdeanCarpatho RusynCelticCentral AmericanCentral American IndianCherokeeCheyenneChickasawChileanChineseChippewaChoctawColombianColvilleComancheCosta RicanCreeCreekCroatianCrowCubanCypriotCzechCzechoslovakianDanishDelawareDominicanDutchDutch West IndianEastern EuropeanEcuadorianEgyptianEnglishEstonianEthiopianEuropeanFijianFilipinoFinnishFrenchFrench American IndianFrench CanadianGermanGerman RussianGhanaianGreekGuamanian/ChamorroGuatemalanGuyaneseHaitianHmongHonduranHopiHoumaHungarianIcelanderIndian (Asian)IndonesianInupiatIranianIraqiIrishIroquoisIsraeliItalianJamaicanJapaneseJordanianKenyanKiowaKoreanLaotianLatvianLebaneseLiberianLithuanianLumbeeLuxembourgerMacedonianMalaysianMalteseMarshalleseMenomineeMexicanMexican American IndianMongolianMoroccanNative HawaiianNavajoNepaleseNew ZealanderNicaraguanNigerianNorthern EuropeanNorwegianOkinawanOsageOttawaPaiutePakistaniPalestinianPanamanianParaguayanPennsylvania GermanPeruvianPimaPolishPortuguesePotawatomiPuebloPuerto RicanPuget Sound SalishRussianSalvadoranSamoanScandinavianScotch-IrishScottishSeminoleSenegaleseSerbianShoshoneSierra LeoneanSiouxSlavicSlovakSloveneSomaliSouth AfricanSouth AmericanSouth American IndianSoviet UnionSpaniardSpanishSpanish AmericanSpanish American IndianSri LankanSubsaharan AfricanSudaneseSwedishSwissSyrianTaiwaneseThaiTlingit-HaidaTohono O'OdhamTonganTrinidadian and TobagonianTsimshianTurkishU.S. Virgin IslanderUgandanUkrainianUruguayanUteVenezuelanVietnameseWelshWest IndianYakamaYaquiYugoslavianYumanYup'ikZimbabwean
Immigration
NonimmigrantsImmigrantsAfghanistanAfricaAlbaniaArgentinaArmeniaAsiaAustraliaAustriaBahamasBangladeshBarbadosBelarusBelgiumBelizeBoliviaBosnia and HerzegovinaBrazilBulgariaBurma/MyanmarCabo VerdeCambodiaCameroonCanadaCaribbeanCentral AmericaChileChinaColombiaCongoCosta RicaCroatiaCubaCzechoslovakiaDenmarkDominicaDominican RepublicEastern AfricaEastern AsiaEastern EuropeEcuadorEgyptEl SalvadorEnglandEritreaEthiopiaEuropeFijiFranceGermanyGhanaGreeceGrenadaGuatemalaGuyanaHaitiHondurasHong KongHungaryIndiaIndonesiaIranIraqIrelandIsraelItalyJamaicaJapanJordanKazakhstanKenyaKoreaKuwaitLaosLatin AmericaLatviaLebanonLiberiaLithuaniaMalaysiaMexicoMicronesiaMiddle AfricaMoldovaMoroccoNepalNetherlandsNicaraguaNigeriaNorth AmericaNorth MacedoniaNorthern AfricaNorthern EuropeNorwayOceaniaPakistanPanamaPeruPhilippinesPolandPortugalRomaniaRussiaSaudi ArabiaScotlandSenegalSerbiaSierra LeoneSingaporeSomaliaSouth AfricaSouth AmericaSouth Central AsiaSouth Eastern AsiaSouthern EuropeSpainSri LankaSt. Vincent and the GrenadinesSudanSwedenSwitzerlandSyriaTaiwanThailandTrinidad and TobagoTurkeyUgandaUkraineUruguayUzbekistanVenezuelaVietnamWest IndiesWestern AfricaWestern AsiaWestern EuropeYemenZaireZimbabweAzores
Romanian
Race
Ancestry
AfghanAfricanAlaska NativeAlaskan AthabascanAlbanianAleutAlsatianAmericanApacheArabArapahoArgentineanArmenianAssyrian/Chaldean/SyriacAustralianAustrianBahamianBangladeshiBarbadianBasqueBelgianBelizeanBermudanBhutaneseBlackfeetBolivianBrazilianBritishBritish West IndianBulgarianCajunCambodianCanadianCape VerdeanCarpatho RusynCelticCentral AmericanCentral American IndianCherokeeCheyenneChickasawChileanChineseChippewaChoctawColombianColvilleComancheCosta RicanCreeCreekCroatianCrowCubanCypriotCzechCzechoslovakianDanishDelawareDominicanDutchDutch West IndianEastern EuropeanEcuadorianEgyptianEnglishEstonianEthiopianEuropeanFijianFilipinoFinnishFrenchFrench American IndianFrench CanadianGermanGerman RussianGhanaianGreekGuamanian/ChamorroGuatemalanGuyaneseHaitianHmongHonduranHopiHoumaHungarianIcelanderIndian (Asian)IndonesianInupiatIranianIraqiIrishIroquoisIsraeliItalianJamaicanJapaneseJordanianKenyanKiowaKoreanLaotianLatvianLebaneseLiberianLithuanianLumbeeLuxembourgerMacedonianMalaysianMalteseMarshalleseMenomineeMexicanMexican American IndianMongolianMoroccanNative HawaiianNavajoNepaleseNew ZealanderNicaraguanNigerianNorthern EuropeanNorwegianOkinawanOsageOttawaPaiutePakistaniPalestinianPanamanianParaguayanPennsylvania GermanPeruvianPimaPolishPortuguesePotawatomiPuebloPuerto RicanPuget Sound SalishRomanianRussianSalvadoranSamoanScandinavianScotch-IrishScottishSeminoleSenegaleseSerbianShoshoneSierra LeoneanSiouxSlavicSlovakSloveneSomaliSouth AfricanSouth AmericanSouth American IndianSoviet UnionSpaniardSpanishSpanish AmericanSpanish American IndianSri LankanSubsaharan AfricanSudaneseSwedishSwissSyrianTaiwaneseThaiTlingit-HaidaTohono O'OdhamTonganTrinidadian and TobagonianTsimshianTurkishU.S. Virgin IslanderUgandanUkrainianUruguayanUteVenezuelanVietnameseWelshWest IndianYakamaYaquiYugoslavianYumanYup'ikZimbabwean
Immigration
NonimmigrantsImmigrantsAfghanistanAfricaAlbaniaArgentinaArmeniaAsiaAustraliaAustriaBahamasBangladeshBarbadosBelarusBelgiumBelizeBoliviaBosnia and HerzegovinaBrazilBulgariaBurma/MyanmarCabo VerdeCambodiaCameroonCanadaCaribbeanCentral AmericaChileChinaColombiaCongoCosta RicaCroatiaCubaCzechoslovakiaDenmarkDominicaDominican RepublicEastern AfricaEastern AsiaEastern EuropeEcuadorEgyptEl SalvadorEnglandEritreaEthiopiaEuropeFijiFranceGermanyGhanaGreeceGrenadaGuatemalaGuyanaHaitiHondurasHong KongHungaryIndiaIndonesiaIranIraqIrelandIsraelItalyJamaicaJapanJordanKazakhstanKenyaKoreaKuwaitLaosLatin AmericaLatviaLebanonLiberiaLithuaniaMalaysiaMexicoMicronesiaMiddle AfricaMoldovaMoroccoNepalNetherlandsNicaraguaNigeriaNorth AmericaNorth MacedoniaNorthern AfricaNorthern EuropeNorwayOceaniaPakistanPanamaPeruPhilippinesPolandPortugalRomaniaRussiaSaudi ArabiaScotlandSenegalSerbiaSierra LeoneSingaporeSomaliaSouth AfricaSouth AmericaSouth Central AsiaSouth Eastern AsiaSouthern EuropeSpainSri LankaSt. Vincent and the GrenadinesSudanSwedenSwitzerlandSyriaTaiwanThailandTrinidad and TobagoTurkeyUgandaUkraineUruguayUzbekistanVenezuelaVietnamWest IndiesWestern AfricaWestern AsiaWestern EuropeYemenZaireZimbabweAzores
Bachelor's Degree
Income
Poverty
Unemployment
Labor Participation
Family Structure
Vehicle Availability
Education Level
Disability

Bachelor's Degree Comparison

Burmese

Romanians

Exceptional
Exceptional
46.9%
BACHELOR'S DEGREE
100.0/ 100
METRIC RATING
25th/ 347
METRIC RANK
41.6%
BACHELOR'S DEGREE
98.4/ 100
METRIC RATING
97th/ 347
METRIC RANK

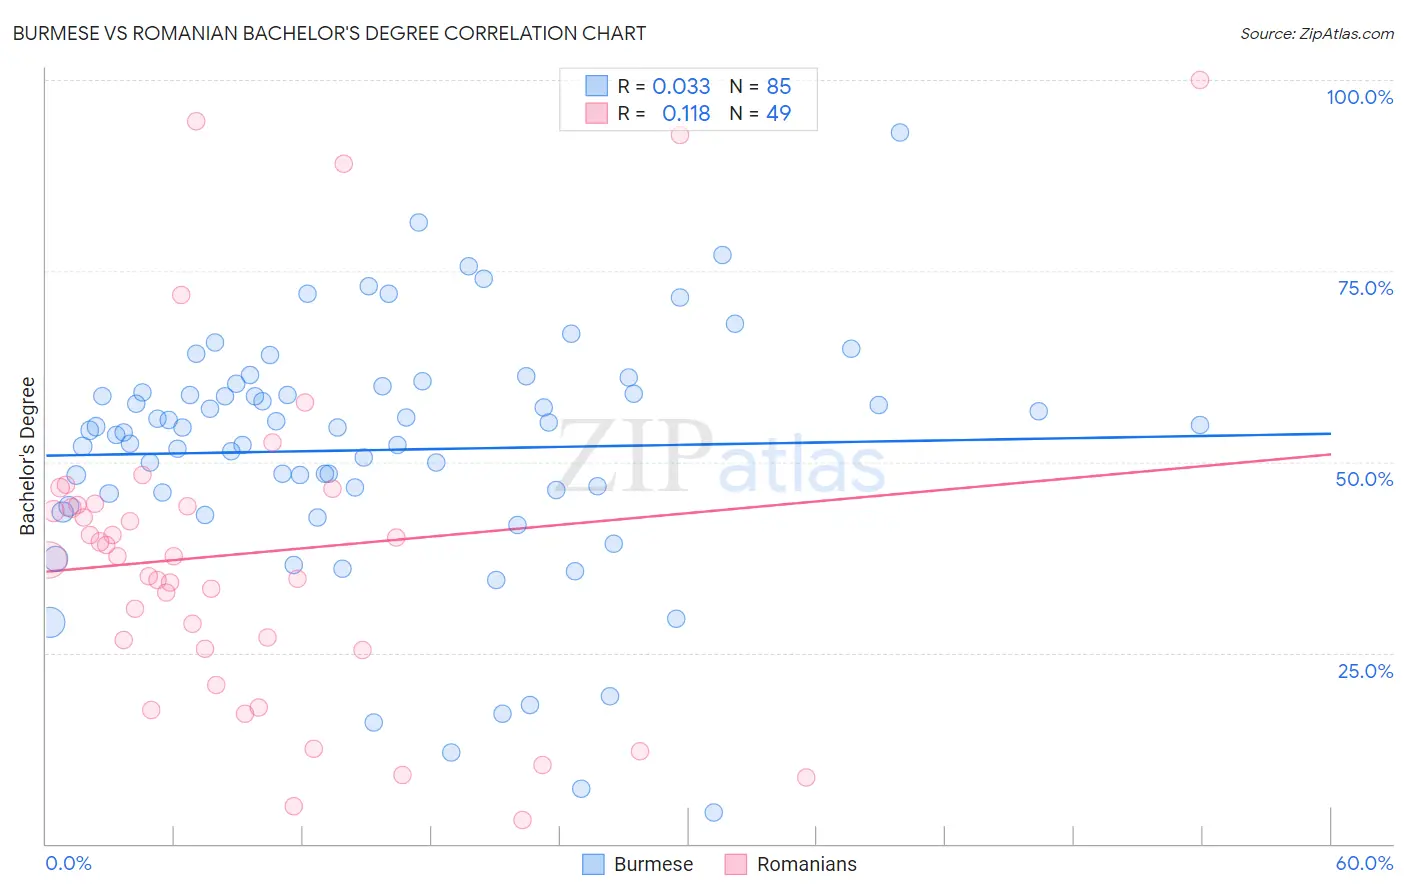
Burmese vs Romanian Bachelor's Degree Correlation Chart

The statistical analysis conducted on geographies consisting of 465,330,560 people shows no correlation between the proportion of Burmese and percentage of population with at least bachelor's degree education in the United States with a correlation coefficient (R) of 0.033 and weighted average of 46.9%. Similarly, the statistical analysis conducted on geographies consisting of 377,865,873 people shows a poor positive correlation between the proportion of Romanians and percentage of population with at least bachelor's degree education in the United States with a correlation coefficient (R) of 0.118 and weighted average of 41.6%, a difference of 12.7%.
Burmese vs Romanian Bachelor's Degree

Bachelor's Degree Correlation Summary

MeasurementBurmeseRomanian
Minimum4.0%3.1%
Maximum93.1%100.0%
Range89.1%96.9%
Mean51.6%38.1%
Median54.4%37.6%
Interquartile 25% (IQ1)45.9%25.5%
Interquartile 75% (IQ3)59.5%44.4%
Interquartile Range (IQR)13.6%18.9%
Standard Deviation (Sample)16.1%22.1%
Standard Deviation (Population)16.0%21.9%

Similar Demographics by Bachelor's Degree

Demographics Similar to Burmese by Bachelor's Degree

In terms of bachelor's degree, the demographic groups most similar to Burmese are Immigrants from Japan (46.8%, a difference of 0.10%), Immigrants from Korea (47.0%, a difference of 0.22%), Immigrants from Sweden (47.0%, a difference of 0.26%), Immigrants from Belgium (47.0%, a difference of 0.35%), and Immigrants from Ireland (47.1%, a difference of 0.55%).
DemographicsRating | RankBachelor's Degree
Indians (Asian)
100.0
/100
|
#18
Exceptional
47.4%
Cambodians
100.0
/100
|
#19
Exceptional
47.2%
Immigrants | Switzerland
100.0
/100
|
#20
Exceptional
47.1%
Immigrants | Ireland
100.0
/100
|
#21
Exceptional
47.1%
Immigrants | Belgium
100.0
/100
|
#22
Exceptional
47.0%
Immigrants | Sweden
100.0
/100
|
#23
Exceptional
47.0%
Immigrants | Korea
100.0
/100
|
#24
Exceptional
47.0%
Burmese
100.0
/100
|
#25
Exceptional
46.9%
Immigrants | Japan
100.0
/100
|
#26
Exceptional
46.8%
Immigrants | France
100.0
/100
|
#27
Exceptional
46.4%
Turks
100.0
/100
|
#28
Exceptional
46.2%
Israelis
100.0
/100
|
#29
Exceptional
46.1%
Immigrants | Sri Lanka
100.0
/100
|
#30
Exceptional
46.1%
Latvians
100.0
/100
|
#31
Exceptional
46.1%
Immigrants | Turkey
100.0
/100
|
#32
Exceptional
46.0%

Demographics Similar to Romanians by Bachelor's Degree

In terms of bachelor's degree, the demographic groups most similar to Romanians are Immigrants from Moldova (41.6%, a difference of 0.050%), Immigrants from Ukraine (41.5%, a difference of 0.11%), Immigrants from North America (41.7%, a difference of 0.16%), Immigrants from Nepal (41.7%, a difference of 0.29%), and Immigrants from Canada (41.7%, a difference of 0.31%).
DemographicsRating | RankBachelor's Degree
Laotians
98.9
/100
|
#90
Exceptional
42.0%
Immigrants | Northern Africa
98.9
/100
|
#91
Exceptional
41.9%
Maltese
98.8
/100
|
#92
Exceptional
41.9%
Immigrants | Canada
98.6
/100
|
#93
Exceptional
41.7%
Immigrants | Nepal
98.6
/100
|
#94
Exceptional
41.7%
Immigrants | North America
98.5
/100
|
#95
Exceptional
41.7%
Immigrants | Moldova
98.4
/100
|
#96
Exceptional
41.6%
Romanians
98.4
/100
|
#97
Exceptional
41.6%
Immigrants | Ukraine
98.3
/100
|
#98
Exceptional
41.5%
Immigrants | England
98.1
/100
|
#99
Exceptional
41.4%
Macedonians
98.1
/100
|
#100
Exceptional
41.4%
Immigrants | Morocco
98.0
/100
|
#101
Exceptional
41.4%
Immigrants | Italy
97.8
/100
|
#102
Exceptional
41.3%
Chileans
97.5
/100
|
#103
Exceptional
41.2%
Jordanians
97.4
/100
|
#104
Exceptional
41.2%