Burmese vs Immigrants from Taiwan Associate's Degree
COMPARE
Burmese
Immigrants from Taiwan
Associate's Degree
Associate's Degree Comparison
Burmese
Immigrants from Taiwan
54.6%
ASSOCIATE'S DEGREE
100.0/ 100
METRIC RATING
23rd/ 347
METRIC RANK
58.4%
ASSOCIATE'S DEGREE
100.0/ 100
METRIC RATING
4th/ 347
METRIC RANK
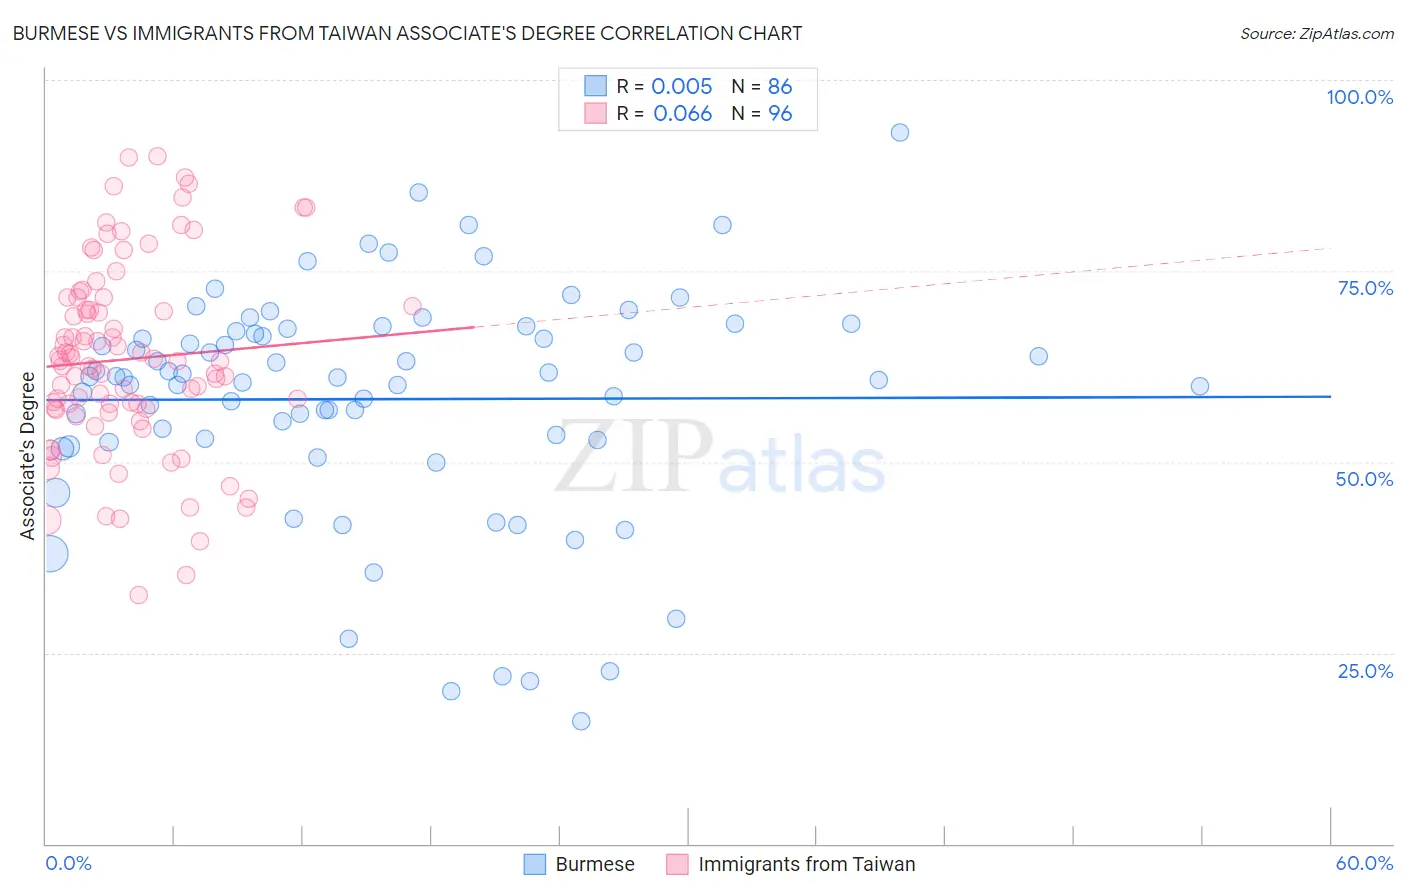
Burmese vs Immigrants from Taiwan Associate's Degree Correlation Chart
The statistical analysis conducted on geographies consisting of 465,354,264 people shows no correlation between the proportion of Burmese and percentage of population with at least associate's degree education in the United States with a correlation coefficient (R) of 0.005 and weighted average of 54.6%. Similarly, the statistical analysis conducted on geographies consisting of 298,276,858 people shows a slight positive correlation between the proportion of Immigrants from Taiwan and percentage of population with at least associate's degree education in the United States with a correlation coefficient (R) of 0.066 and weighted average of 58.4%, a difference of 7.0%.
Associate's Degree Correlation Summary
| Measurement | Burmese | Immigrants from Taiwan |
| Minimum | 16.1% | 32.5% |
| Maximum | 93.1% | 89.9% |
| Range | 77.0% | 57.4% |
| Mean | 58.2% | 63.4% |
| Median | 61.0% | 63.2% |
| Interquartile 25% (IQ1) | 52.9% | 56.9% |
| Interquartile 75% (IQ3) | 67.1% | 70.9% |
| Interquartile Range (IQR) | 14.2% | 14.0% |
| Standard Deviation (Sample) | 15.0% | 12.4% |
| Standard Deviation (Population) | 14.9% | 12.4% |
Demographics Similar to Burmese and Immigrants from Taiwan by Associate's Degree
In terms of associate's degree, the demographic groups most similar to Burmese are Immigrants from Japan (54.6%, a difference of 0.0%), Immigrants from Sweden (54.6%, a difference of 0.030%), Cambodian (54.6%, a difference of 0.10%), Immigrants from Ireland (54.7%, a difference of 0.12%), and Indian (Asian) (54.8%, a difference of 0.34%). Similarly, the demographic groups most similar to Immigrants from Taiwan are Immigrants from India (58.5%, a difference of 0.25%), Iranian (58.2%, a difference of 0.41%), Okinawan (57.7%, a difference of 1.2%), Immigrants from Iran (57.7%, a difference of 1.3%), and Thai (57.4%, a difference of 1.7%).
| Demographics | Rating | Rank | Associate's Degree |
| Immigrants | India | 100.0 /100 | #3 | Exceptional 58.5% |
| Immigrants | Taiwan | 100.0 /100 | #4 | Exceptional 58.4% |
| Iranians | 100.0 /100 | #5 | Exceptional 58.2% |
| Okinawans | 100.0 /100 | #6 | Exceptional 57.7% |
| Immigrants | Iran | 100.0 /100 | #7 | Exceptional 57.7% |
| Thais | 100.0 /100 | #8 | Exceptional 57.4% |
| Immigrants | Israel | 100.0 /100 | #9 | Exceptional 56.8% |
| Cypriots | 100.0 /100 | #10 | Exceptional 56.4% |
| Immigrants | Australia | 100.0 /100 | #11 | Exceptional 55.8% |
| Immigrants | South Central Asia | 100.0 /100 | #12 | Exceptional 55.7% |
| Immigrants | China | 100.0 /100 | #13 | Exceptional 55.5% |
| Immigrants | Hong Kong | 100.0 /100 | #14 | Exceptional 55.4% |
| Immigrants | Eastern Asia | 100.0 /100 | #15 | Exceptional 55.4% |
| Soviet Union | 100.0 /100 | #16 | Exceptional 55.1% |
| Eastern Europeans | 100.0 /100 | #17 | Exceptional 55.0% |
| Indians (Asian) | 100.0 /100 | #18 | Exceptional 54.8% |
| Immigrants | Ireland | 100.0 /100 | #19 | Exceptional 54.7% |
| Cambodians | 100.0 /100 | #20 | Exceptional 54.6% |
| Immigrants | Sweden | 100.0 /100 | #21 | Exceptional 54.6% |
| Immigrants | Japan | 100.0 /100 | #22 | Exceptional 54.6% |
| Burmese | 100.0 /100 | #23 | Exceptional 54.6% |