Burmese vs French American Indian GED/Equivalency

COMPARE

Burmese
Race
Ancestry
AfghanAfricanAlaska NativeAlaskan AthabascanAlbanianAleutAlsatianAmericanApacheArabArapahoArgentineanArmenianAssyrian/Chaldean/SyriacAustralianAustrianBahamianBangladeshiBarbadianBasqueBelgianBelizeanBermudanBhutaneseBlackfeetBolivianBrazilianBritishBritish West IndianBulgarianBurmeseCajunCambodianCanadianCape VerdeanCarpatho RusynCelticCentral AmericanCentral American IndianCherokeeCheyenneChickasawChileanChineseChippewaChoctawColombianColvilleComancheCosta RicanCreeCreekCroatianCrowCubanCypriotCzechCzechoslovakianDanishDelawareDominicanDutchDutch West IndianEastern EuropeanEcuadorianEgyptianEnglishEstonianEthiopianEuropeanFijianFilipinoFinnishFrenchFrench CanadianGermanGerman RussianGhanaianGreekGuamanian/ChamorroGuatemalanGuyaneseHaitianHmongHonduranHopiHoumaHungarianIcelanderIndian (Asian)IndonesianInupiatIranianIraqiIrishIroquoisIsraeliItalianJamaicanJapaneseJordanianKenyanKiowaKoreanLaotianLatvianLebaneseLiberianLithuanianLumbeeLuxembourgerMacedonianMalaysianMalteseMarshalleseMenomineeMexicanMexican American IndianMongolianMoroccanNative HawaiianNavajoNepaleseNew ZealanderNicaraguanNigerianNorthern EuropeanNorwegianOkinawanOsageOttawaPaiutePakistaniPalestinianPanamanianParaguayanPennsylvania GermanPeruvianPimaPolishPortuguesePotawatomiPuebloPuerto RicanPuget Sound SalishRomanianRussianSalvadoranSamoanScandinavianScotch-IrishScottishSeminoleSenegaleseSerbianShoshoneSierra LeoneanSiouxSlavicSlovakSloveneSomaliSouth AfricanSouth AmericanSouth American IndianSoviet UnionSpaniardSpanishSpanish AmericanSpanish American IndianSri LankanSubsaharan AfricanSudaneseSwedishSwissSyrianTaiwaneseThaiTlingit-HaidaTohono O'OdhamTonganTrinidadian and TobagonianTsimshianTurkishU.S. Virgin IslanderUgandanUkrainianUruguayanUteVenezuelanVietnameseWelshWest IndianYakamaYaquiYugoslavianYumanYup'ikZimbabwean
Immigration
NonimmigrantsImmigrantsAfghanistanAfricaAlbaniaArgentinaArmeniaAsiaAustraliaAustriaBahamasBangladeshBarbadosBelarusBelgiumBelizeBoliviaBosnia and HerzegovinaBrazilBulgariaBurma/MyanmarCabo VerdeCambodiaCameroonCanadaCaribbeanCentral AmericaChileChinaColombiaCongoCosta RicaCroatiaCubaCzechoslovakiaDenmarkDominicaDominican RepublicEastern AfricaEastern AsiaEastern EuropeEcuadorEgyptEl SalvadorEnglandEritreaEthiopiaEuropeFijiFranceGermanyGhanaGreeceGrenadaGuatemalaGuyanaHaitiHondurasHong KongHungaryIndiaIndonesiaIranIraqIrelandIsraelItalyJamaicaJapanJordanKazakhstanKenyaKoreaKuwaitLaosLatin AmericaLatviaLebanonLiberiaLithuaniaMalaysiaMexicoMicronesiaMiddle AfricaMoldovaMoroccoNepalNetherlandsNicaraguaNigeriaNorth AmericaNorth MacedoniaNorthern AfricaNorthern EuropeNorwayOceaniaPakistanPanamaPeruPhilippinesPolandPortugalRomaniaRussiaSaudi ArabiaScotlandSenegalSerbiaSierra LeoneSingaporeSomaliaSouth AfricaSouth AmericaSouth Central AsiaSouth Eastern AsiaSouthern EuropeSpainSri LankaSt. Vincent and the GrenadinesSudanSwedenSwitzerlandSyriaTaiwanThailandTrinidad and TobagoTurkeyUgandaUkraineUruguayUzbekistanVenezuelaVietnamWest IndiesWestern AfricaWestern AsiaWestern EuropeYemenZaireZimbabweAzores
French American Indian
Race
Ancestry
AfghanAfricanAlaska NativeAlaskan AthabascanAlbanianAleutAlsatianAmericanApacheArabArapahoArgentineanArmenianAssyrian/Chaldean/SyriacAustralianAustrianBahamianBangladeshiBarbadianBasqueBelgianBelizeanBermudanBhutaneseBlackfeetBolivianBrazilianBritishBritish West IndianBulgarianCajunCambodianCanadianCape VerdeanCarpatho RusynCelticCentral AmericanCentral American IndianCherokeeCheyenneChickasawChileanChineseChippewaChoctawColombianColvilleComancheCosta RicanCreeCreekCroatianCrowCubanCypriotCzechCzechoslovakianDanishDelawareDominicanDutchDutch West IndianEastern EuropeanEcuadorianEgyptianEnglishEstonianEthiopianEuropeanFijianFilipinoFinnishFrenchFrench American IndianFrench CanadianGermanGerman RussianGhanaianGreekGuamanian/ChamorroGuatemalanGuyaneseHaitianHmongHonduranHopiHoumaHungarianIcelanderIndian (Asian)IndonesianInupiatIranianIraqiIrishIroquoisIsraeliItalianJamaicanJapaneseJordanianKenyanKiowaKoreanLaotianLatvianLebaneseLiberianLithuanianLumbeeLuxembourgerMacedonianMalaysianMalteseMarshalleseMenomineeMexicanMexican American IndianMongolianMoroccanNative HawaiianNavajoNepaleseNew ZealanderNicaraguanNigerianNorthern EuropeanNorwegianOkinawanOsageOttawaPaiutePakistaniPalestinianPanamanianParaguayanPennsylvania GermanPeruvianPimaPolishPortuguesePotawatomiPuebloPuerto RicanPuget Sound SalishRomanianRussianSalvadoranSamoanScandinavianScotch-IrishScottishSeminoleSenegaleseSerbianShoshoneSierra LeoneanSiouxSlavicSlovakSloveneSomaliSouth AfricanSouth AmericanSouth American IndianSoviet UnionSpaniardSpanishSpanish AmericanSpanish American IndianSri LankanSubsaharan AfricanSudaneseSwedishSwissSyrianTaiwaneseThaiTlingit-HaidaTohono O'OdhamTonganTrinidadian and TobagonianTsimshianTurkishU.S. Virgin IslanderUgandanUkrainianUruguayanUteVenezuelanVietnameseWelshWest IndianYakamaYaquiYugoslavianYumanYup'ikZimbabwean
Immigration
NonimmigrantsImmigrantsAfghanistanAfricaAlbaniaArgentinaArmeniaAsiaAustraliaAustriaBahamasBangladeshBarbadosBelarusBelgiumBelizeBoliviaBosnia and HerzegovinaBrazilBulgariaBurma/MyanmarCabo VerdeCambodiaCameroonCanadaCaribbeanCentral AmericaChileChinaColombiaCongoCosta RicaCroatiaCubaCzechoslovakiaDenmarkDominicaDominican RepublicEastern AfricaEastern AsiaEastern EuropeEcuadorEgyptEl SalvadorEnglandEritreaEthiopiaEuropeFijiFranceGermanyGhanaGreeceGrenadaGuatemalaGuyanaHaitiHondurasHong KongHungaryIndiaIndonesiaIranIraqIrelandIsraelItalyJamaicaJapanJordanKazakhstanKenyaKoreaKuwaitLaosLatin AmericaLatviaLebanonLiberiaLithuaniaMalaysiaMexicoMicronesiaMiddle AfricaMoldovaMoroccoNepalNetherlandsNicaraguaNigeriaNorth AmericaNorth MacedoniaNorthern AfricaNorthern EuropeNorwayOceaniaPakistanPanamaPeruPhilippinesPolandPortugalRomaniaRussiaSaudi ArabiaScotlandSenegalSerbiaSierra LeoneSingaporeSomaliaSouth AfricaSouth AmericaSouth Central AsiaSouth Eastern AsiaSouthern EuropeSpainSri LankaSt. Vincent and the GrenadinesSudanSwedenSwitzerlandSyriaTaiwanThailandTrinidad and TobagoTurkeyUgandaUkraineUruguayUzbekistanVenezuelaVietnamWest IndiesWestern AfricaWestern AsiaWestern EuropeYemenZaireZimbabweAzores
GED/Equivalency
Income
Poverty
Unemployment
Labor Participation
Family Structure
Vehicle Availability
Education Level
Disability

GED/Equivalency Comparison

Burmese

French American Indians

Exceptional
Tragic
88.3%
GED/EQUIVALENCY
99.7/ 100
METRIC RATING
38th/ 347
METRIC RANK
84.6%
GED/EQUIVALENCY
6.3/ 100
METRIC RATING
224th/ 347
METRIC RANK

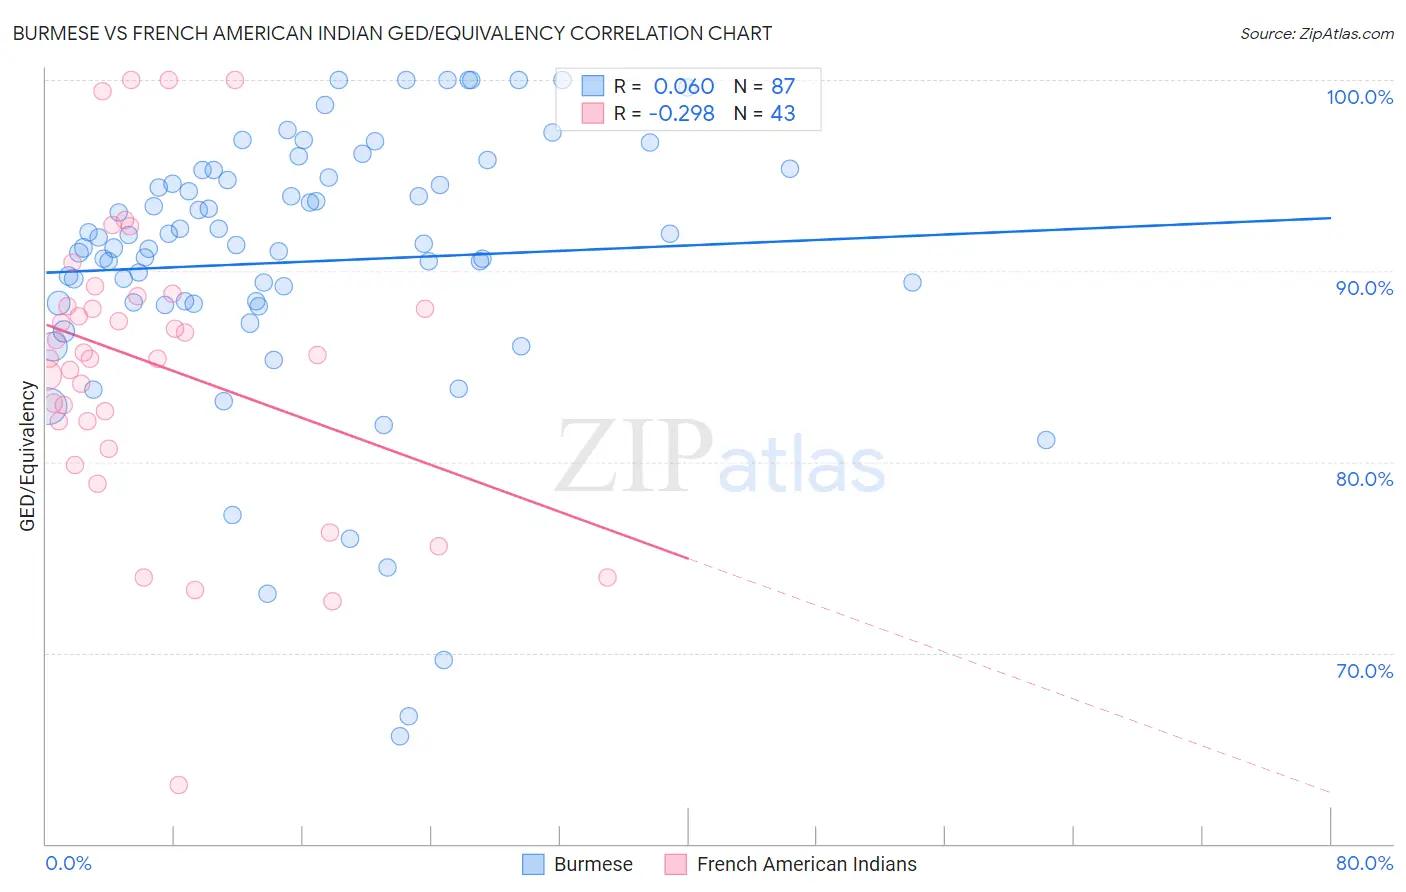
Burmese vs French American Indian GED/Equivalency Correlation Chart

The statistical analysis conducted on geographies consisting of 465,408,087 people shows a slight positive correlation between the proportion of Burmese and percentage of population with at least ged/equivalency education in the United States with a correlation coefficient (R) of 0.060 and weighted average of 88.3%. Similarly, the statistical analysis conducted on geographies consisting of 131,976,269 people shows a weak negative correlation between the proportion of French American Indians and percentage of population with at least ged/equivalency education in the United States with a correlation coefficient (R) of -0.298 and weighted average of 84.6%, a difference of 4.4%.
Burmese vs French American Indian GED/Equivalency

GED/Equivalency Correlation Summary

MeasurementBurmeseFrench American Indian
Minimum65.6%63.0%
Maximum100.0%100.0%
Range34.4%37.0%
Mean90.5%85.2%
Median91.4%85.6%
Interquartile 25% (IQ1)88.3%82.1%
Interquartile 75% (IQ3)94.9%88.7%
Interquartile Range (IQR)6.6%6.6%
Standard Deviation (Sample)7.2%7.7%
Standard Deviation (Population)7.1%7.6%

Similar Demographics by GED/Equivalency

Demographics Similar to Burmese by GED/Equivalency

In terms of ged/equivalency, the demographic groups most similar to Burmese are Immigrants from Austria (88.3%, a difference of 0.030%), Immigrants from Belgium (88.3%, a difference of 0.060%), Immigrants from South Central Asia (88.4%, a difference of 0.080%), Immigrants from Israel (88.2%, a difference of 0.090%), and Immigrants from Sweden (88.4%, a difference of 0.10%).
DemographicsRating | RankGED/Equivalency
Bhutanese
99.8
/100
|
#31
Exceptional
88.4%
Danes
99.8
/100
|
#32
Exceptional
88.4%
Immigrants | Sweden
99.7
/100
|
#33
Exceptional
88.4%
Immigrants | Japan
99.7
/100
|
#34
Exceptional
88.4%
Immigrants | South Central Asia
99.7
/100
|
#35
Exceptional
88.4%
Immigrants | Belgium
99.7
/100
|
#36
Exceptional
88.3%
Immigrants | Austria
99.7
/100
|
#37
Exceptional
88.3%
Burmese
99.7
/100
|
#38
Exceptional
88.3%
Immigrants | Israel
99.6
/100
|
#39
Exceptional
88.2%
Italians
99.6
/100
|
#40
Exceptional
88.2%
Finns
99.6
/100
|
#41
Exceptional
88.2%
Cambodians
99.6
/100
|
#42
Exceptional
88.2%
Immigrants | Scotland
99.6
/100
|
#43
Exceptional
88.2%
Macedonians
99.5
/100
|
#44
Exceptional
88.1%
Czechs
99.5
/100
|
#45
Exceptional
88.1%

Demographics Similar to French American Indians by GED/Equivalency

In terms of ged/equivalency, the demographic groups most similar to French American Indians are Immigrants from Thailand (84.5%, a difference of 0.050%), Immigrants from Uzbekistan (84.6%, a difference of 0.070%), Immigrants from Zaire (84.5%, a difference of 0.080%), Iroquois (84.6%, a difference of 0.090%), and Immigrants from Costa Rica (84.5%, a difference of 0.090%).
DemographicsRating | RankGED/Equivalency
Nigerians
8.6
/100
|
#217
Tragic
84.7%
Alaska Natives
8.6
/100
|
#218
Tragic
84.7%
Potawatomi
8.2
/100
|
#219
Tragic
84.7%
Americans
8.2
/100
|
#220
Tragic
84.7%
Taiwanese
8.1
/100
|
#221
Tragic
84.7%
Iroquois
7.5
/100
|
#222
Tragic
84.6%
Immigrants | Uzbekistan
7.1
/100
|
#223
Tragic
84.6%
French American Indians
6.3
/100
|
#224
Tragic
84.6%
Immigrants | Thailand
5.8
/100
|
#225
Tragic
84.5%
Immigrants | Zaire
5.5
/100
|
#226
Tragic
84.5%
Immigrants | Costa Rica
5.4
/100
|
#227
Tragic
84.5%
Immigrants | Liberia
4.9
/100
|
#228
Tragic
84.4%
Immigrants | Uruguay
4.6
/100
|
#229
Tragic
84.4%
Immigrants | Colombia
4.5
/100
|
#230
Tragic
84.4%
Immigrants | Middle Africa
4.3
/100
|
#231
Tragic
84.4%