Bulgarian vs Immigrants from Korea High School Diploma
COMPARE
Bulgarian
Immigrants from Korea
High School Diploma
High School Diploma Comparison
Bulgarians
Immigrants from Korea
91.8%
HIGH SCHOOL DIPLOMA
100.0/ 100
METRIC RATING
14th/ 347
METRIC RANK
90.5%
HIGH SCHOOL DIPLOMA
98.3/ 100
METRIC RATING
98th/ 347
METRIC RANK
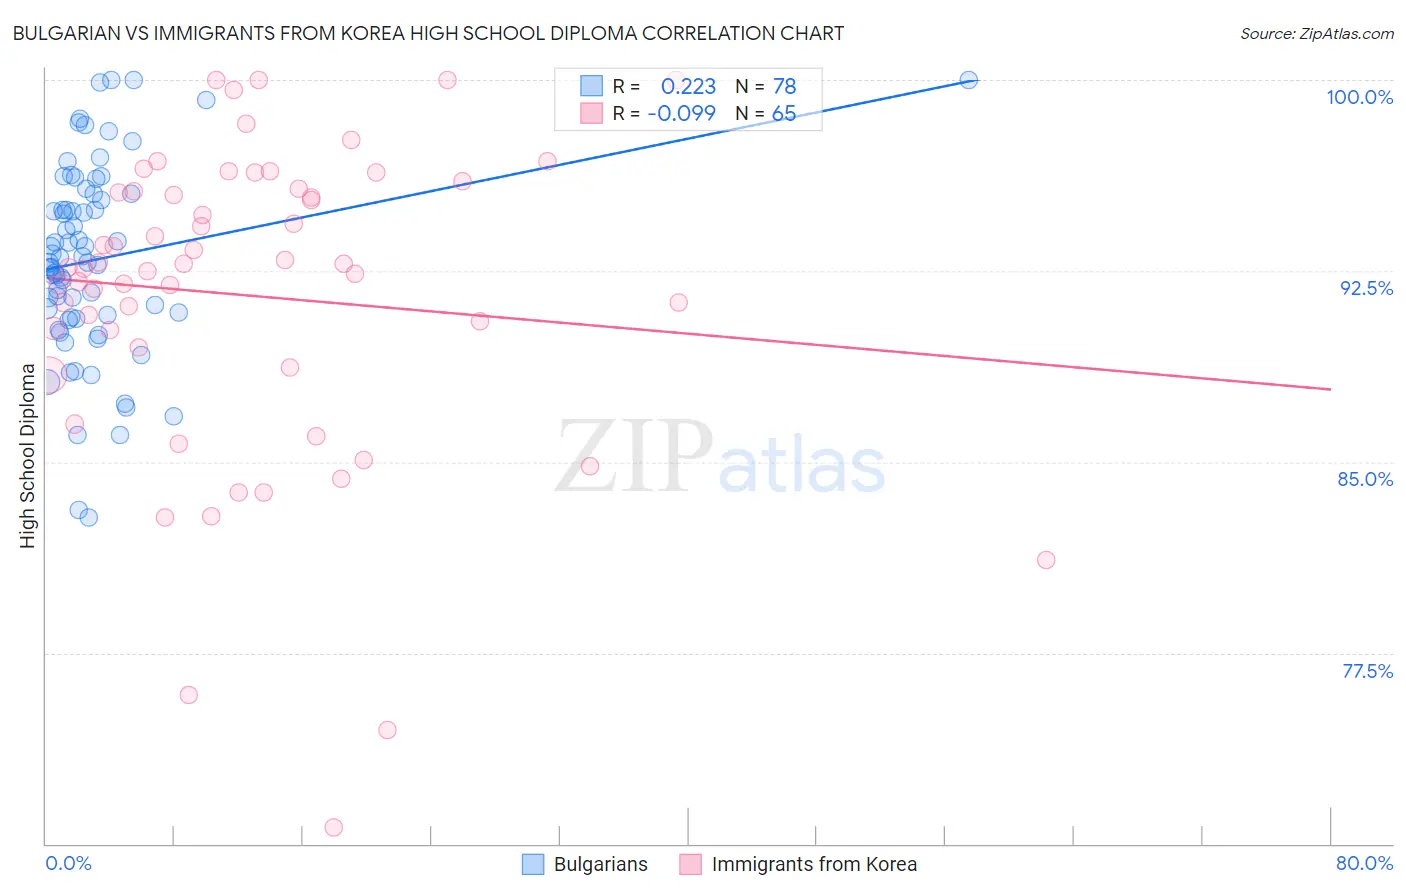
Bulgarian vs Immigrants from Korea High School Diploma Correlation Chart
The statistical analysis conducted on geographies consisting of 205,633,404 people shows a weak positive correlation between the proportion of Bulgarians and percentage of population with at least high school diploma education in the United States with a correlation coefficient (R) of 0.223 and weighted average of 91.8%. Similarly, the statistical analysis conducted on geographies consisting of 416,280,217 people shows a slight negative correlation between the proportion of Immigrants from Korea and percentage of population with at least high school diploma education in the United States with a correlation coefficient (R) of -0.099 and weighted average of 90.5%, a difference of 1.4%.
High School Diploma Correlation Summary
| Measurement | Bulgarian | Immigrants from Korea |
| Minimum | 82.8% | 70.6% |
| Maximum | 100.0% | 100.0% |
| Range | 17.2% | 29.4% |
| Mean | 93.0% | 91.5% |
| Median | 92.9% | 92.6% |
| Interquartile 25% (IQ1) | 90.7% | 89.1% |
| Interquartile 75% (IQ3) | 95.5% | 95.7% |
| Interquartile Range (IQR) | 4.9% | 6.6% |
| Standard Deviation (Sample) | 3.8% | 6.1% |
| Standard Deviation (Population) | 3.7% | 6.1% |
Similar Demographics by High School Diploma
Demographics Similar to Bulgarians by High School Diploma
In terms of high school diploma, the demographic groups most similar to Bulgarians are Luxembourger (91.7%, a difference of 0.030%), Danish (91.8%, a difference of 0.050%), Finnish (91.7%, a difference of 0.050%), Immigrants from Singapore (91.7%, a difference of 0.090%), and Polish (91.9%, a difference of 0.10%).
| Demographics | Rating | Rank | High School Diploma |
| Immigrants | India | 100.0 /100 | #7 | Exceptional 92.0% |
| Chinese | 100.0 /100 | #8 | Exceptional 92.0% |
| Latvians | 100.0 /100 | #9 | Exceptional 92.0% |
| Croatians | 100.0 /100 | #10 | Exceptional 92.0% |
| Eastern Europeans | 100.0 /100 | #11 | Exceptional 91.9% |
| Poles | 100.0 /100 | #12 | Exceptional 91.9% |
| Danes | 100.0 /100 | #13 | Exceptional 91.8% |
| Bulgarians | 100.0 /100 | #14 | Exceptional 91.8% |
| Luxembourgers | 100.0 /100 | #15 | Exceptional 91.7% |
| Finns | 100.0 /100 | #16 | Exceptional 91.7% |
| Immigrants | Singapore | 99.9 /100 | #17 | Exceptional 91.7% |
| Germans | 99.9 /100 | #18 | Exceptional 91.7% |
| Maltese | 99.9 /100 | #19 | Exceptional 91.6% |
| Czechs | 99.9 /100 | #20 | Exceptional 91.6% |
| Filipinos | 99.9 /100 | #21 | Exceptional 91.6% |
Demographics Similar to Immigrants from Korea by High School Diploma
In terms of high school diploma, the demographic groups most similar to Immigrants from Korea are Immigrants from Kuwait (90.5%, a difference of 0.0%), Immigrants from Europe (90.5%, a difference of 0.020%), Immigrants from Serbia (90.5%, a difference of 0.030%), Immigrants from North Macedonia (90.5%, a difference of 0.030%), and Immigrants from Israel (90.5%, a difference of 0.040%).
| Demographics | Rating | Rank | High School Diploma |
| South Africans | 98.6 /100 | #91 | Exceptional 90.6% |
| Swiss | 98.6 /100 | #92 | Exceptional 90.6% |
| Immigrants | Western Europe | 98.6 /100 | #93 | Exceptional 90.6% |
| Immigrants | Israel | 98.5 /100 | #94 | Exceptional 90.5% |
| Icelanders | 98.5 /100 | #95 | Exceptional 90.5% |
| Immigrants | Serbia | 98.4 /100 | #96 | Exceptional 90.5% |
| Immigrants | Kuwait | 98.3 /100 | #97 | Exceptional 90.5% |
| Immigrants | Korea | 98.3 /100 | #98 | Exceptional 90.5% |
| Immigrants | Europe | 98.2 /100 | #99 | Exceptional 90.5% |
| Immigrants | North Macedonia | 98.1 /100 | #100 | Exceptional 90.5% |
| Immigrants | Norway | 98.0 /100 | #101 | Exceptional 90.5% |
| Aleuts | 98.0 /100 | #102 | Exceptional 90.4% |
| Immigrants | Romania | 97.8 /100 | #103 | Exceptional 90.4% |
| Immigrants | Croatia | 97.8 /100 | #104 | Exceptional 90.4% |
| Lebanese | 97.4 /100 | #105 | Exceptional 90.4% |