Bulgarian vs Immigrants from Italy Professional Degree

COMPARE

Bulgarian
Race
Ancestry
AfghanAfricanAlaska NativeAlaskan AthabascanAlbanianAleutAlsatianAmericanApacheArabArapahoArgentineanArmenianAssyrian/Chaldean/SyriacAustralianAustrianBahamianBangladeshiBarbadianBasqueBelgianBelizeanBermudanBhutaneseBlackfeetBolivianBrazilianBritishBritish West IndianBulgarianBurmeseCajunCambodianCanadianCape VerdeanCarpatho RusynCelticCentral AmericanCentral American IndianCherokeeCheyenneChickasawChileanChineseChippewaChoctawColombianColvilleComancheCosta RicanCreeCreekCroatianCrowCubanCypriotCzechCzechoslovakianDanishDelawareDominicanDutchDutch West IndianEastern EuropeanEcuadorianEgyptianEnglishEstonianEthiopianEuropeanFijianFilipinoFinnishFrenchFrench American IndianFrench CanadianGermanGerman RussianGhanaianGreekGuamanian/ChamorroGuatemalanGuyaneseHaitianHmongHonduranHopiHoumaHungarianIcelanderIndian (Asian)IndonesianInupiatIranianIraqiIrishIroquoisIsraeliItalianJamaicanJapaneseJordanianKenyanKiowaKoreanLaotianLatvianLebaneseLiberianLithuanianLumbeeLuxembourgerMacedonianMalaysianMalteseMarshalleseMenomineeMexicanMexican American IndianMongolianMoroccanNative HawaiianNavajoNepaleseNew ZealanderNicaraguanNigerianNorthern EuropeanNorwegianOkinawanOsageOttawaPaiutePakistaniPalestinianPanamanianParaguayanPennsylvania GermanPeruvianPimaPolishPortuguesePotawatomiPuebloPuerto RicanPuget Sound SalishRomanianRussianSalvadoranSamoanScandinavianScotch-IrishScottishSeminoleSenegaleseSerbianShoshoneSierra LeoneanSiouxSlavicSlovakSloveneSomaliSouth AfricanSouth AmericanSouth American IndianSoviet UnionSpaniardSpanishSpanish AmericanSpanish American IndianSri LankanSubsaharan AfricanSudaneseSwedishSwissSyrianTaiwaneseThaiTlingit-HaidaTohono O'OdhamTonganTrinidadian and TobagonianTsimshianTurkishU.S. Virgin IslanderUgandanUkrainianUruguayanUteVenezuelanVietnameseWelshWest IndianYakamaYaquiYugoslavianYumanYup'ikZimbabwean
Immigration
NonimmigrantsImmigrantsAfghanistanAfricaAlbaniaArgentinaArmeniaAsiaAustraliaAustriaBahamasBangladeshBarbadosBelarusBelgiumBelizeBoliviaBosnia and HerzegovinaBrazilBulgariaBurma/MyanmarCabo VerdeCambodiaCameroonCanadaCaribbeanCentral AmericaChileChinaColombiaCongoCosta RicaCroatiaCubaCzechoslovakiaDenmarkDominicaDominican RepublicEastern AfricaEastern AsiaEastern EuropeEcuadorEgyptEl SalvadorEnglandEritreaEthiopiaEuropeFijiFranceGermanyGhanaGreeceGrenadaGuatemalaGuyanaHaitiHondurasHong KongHungaryIndiaIndonesiaIranIraqIrelandIsraelJamaicaJapanJordanKazakhstanKenyaKoreaKuwaitLaosLatin AmericaLatviaLebanonLiberiaLithuaniaMalaysiaMexicoMicronesiaMiddle AfricaMoldovaMoroccoNepalNetherlandsNicaraguaNigeriaNorth AmericaNorth MacedoniaNorthern AfricaNorthern EuropeNorwayOceaniaPakistanPanamaPeruPhilippinesPolandPortugalRomaniaRussiaSaudi ArabiaScotlandSenegalSerbiaSierra LeoneSingaporeSomaliaSouth AfricaSouth AmericaSouth Central AsiaSouth Eastern AsiaSouthern EuropeSpainSri LankaSt. Vincent and the GrenadinesSudanSwedenSwitzerlandSyriaTaiwanThailandTrinidad and TobagoTurkeyUgandaUkraineUruguayUzbekistanVenezuelaVietnamWest IndiesWestern AfricaWestern AsiaWestern EuropeYemenZaireZimbabweAzores
Immigrants from Italy
Race
Ancestry
AfghanAfricanAlaska NativeAlaskan AthabascanAlbanianAleutAlsatianAmericanApacheArabArapahoArgentineanArmenianAssyrian/Chaldean/SyriacAustralianAustrianBahamianBangladeshiBarbadianBasqueBelgianBelizeanBermudanBhutaneseBlackfeetBolivianBrazilianBritishBritish West IndianBurmeseCajunCambodianCanadianCape VerdeanCarpatho RusynCelticCentral AmericanCentral American IndianCherokeeCheyenneChickasawChileanChineseChippewaChoctawColombianColvilleComancheCosta RicanCreeCreekCroatianCrowCubanCypriotCzechCzechoslovakianDanishDelawareDominicanDutchDutch West IndianEastern EuropeanEcuadorianEgyptianEnglishEstonianEthiopianEuropeanFijianFilipinoFinnishFrenchFrench American IndianFrench CanadianGermanGerman RussianGhanaianGreekGuamanian/ChamorroGuatemalanGuyaneseHaitianHmongHonduranHopiHoumaHungarianIcelanderIndian (Asian)IndonesianInupiatIranianIraqiIrishIroquoisIsraeliItalianJamaicanJapaneseJordanianKenyanKiowaKoreanLaotianLatvianLebaneseLiberianLithuanianLumbeeLuxembourgerMacedonianMalaysianMalteseMarshalleseMenomineeMexicanMexican American IndianMongolianMoroccanNative HawaiianNavajoNepaleseNew ZealanderNicaraguanNigerianNorthern EuropeanNorwegianOkinawanOsageOttawaPaiutePakistaniPalestinianPanamanianParaguayanPennsylvania GermanPeruvianPimaPolishPortuguesePotawatomiPuebloPuerto RicanPuget Sound SalishRomanianRussianSalvadoranSamoanScandinavianScotch-IrishScottishSeminoleSenegaleseSerbianShoshoneSierra LeoneanSiouxSlavicSlovakSloveneSomaliSouth AfricanSouth AmericanSouth American IndianSoviet UnionSpaniardSpanishSpanish AmericanSpanish American IndianSri LankanSubsaharan AfricanSudaneseSwedishSwissSyrianTaiwaneseThaiTlingit-HaidaTohono O'OdhamTonganTrinidadian and TobagonianTsimshianTurkishU.S. Virgin IslanderUgandanUkrainianUruguayanUteVenezuelanVietnameseWelshWest IndianYakamaYaquiYugoslavianYumanYup'ikZimbabwean
Immigration
NonimmigrantsImmigrantsAfghanistanAfricaAlbaniaArgentinaArmeniaAsiaAustraliaAustriaBahamasBangladeshBarbadosBelarusBelgiumBelizeBoliviaBosnia and HerzegovinaBrazilBulgariaBurma/MyanmarCabo VerdeCambodiaCameroonCanadaCaribbeanCentral AmericaChileChinaColombiaCongoCosta RicaCroatiaCubaCzechoslovakiaDenmarkDominicaDominican RepublicEastern AfricaEastern AsiaEastern EuropeEcuadorEgyptEl SalvadorEnglandEritreaEthiopiaEuropeFijiFranceGermanyGhanaGreeceGrenadaGuatemalaGuyanaHaitiHondurasHong KongHungaryIndiaIndonesiaIranIraqIrelandIsraelItalyJamaicaJapanJordanKazakhstanKenyaKoreaKuwaitLaosLatin AmericaLatviaLebanonLiberiaLithuaniaMalaysiaMexicoMicronesiaMiddle AfricaMoldovaMoroccoNepalNetherlandsNicaraguaNigeriaNorth AmericaNorth MacedoniaNorthern AfricaNorthern EuropeNorwayOceaniaPakistanPanamaPeruPhilippinesPolandPortugalRomaniaRussiaSaudi ArabiaScotlandSenegalSerbiaSierra LeoneSingaporeSomaliaSouth AfricaSouth AmericaSouth Central AsiaSouth Eastern AsiaSouthern EuropeSpainSri LankaSt. Vincent and the GrenadinesSudanSwedenSwitzerlandSyriaTaiwanThailandTrinidad and TobagoTurkeyUgandaUkraineUruguayUzbekistanVenezuelaVietnamWest IndiesWestern AfricaWestern AsiaWestern EuropeYemenZaireZimbabweAzores
Professional Degree
Income
Poverty
Unemployment
Labor Participation
Family Structure
Vehicle Availability
Education Level
Disability

Professional Degree Comparison

Bulgarians

Immigrants from Italy

Exceptional
Exceptional
5.7%
PROFESSIONAL DEGREE
100.0/ 100
METRIC RATING
58th/ 347
METRIC RANK
5.2%
PROFESSIONAL DEGREE
99.1/ 100
METRIC RATING
99th/ 347
METRIC RANK

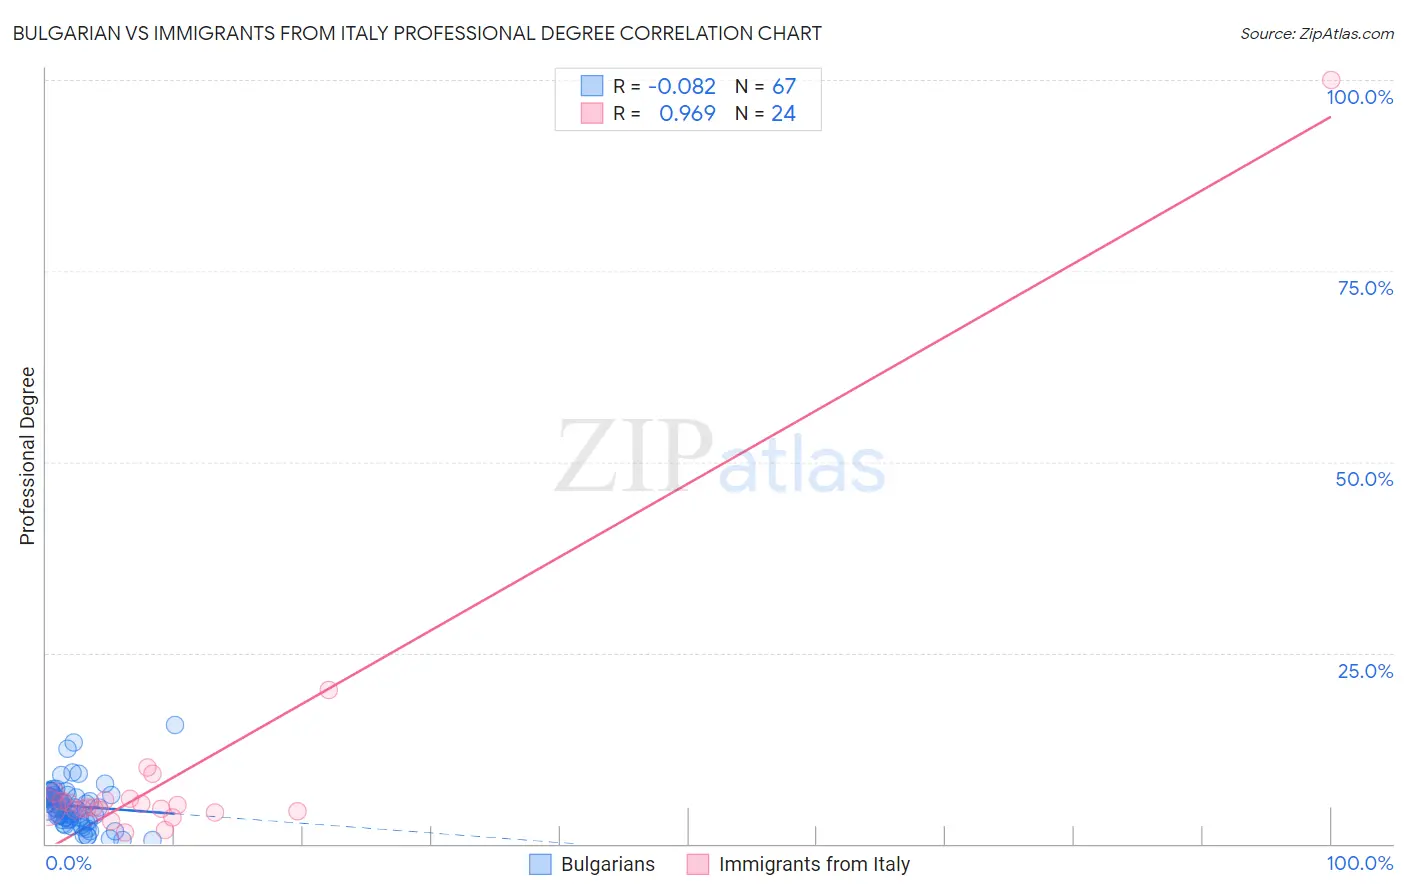
Bulgarian vs Immigrants from Italy Professional Degree Correlation Chart

The statistical analysis conducted on geographies consisting of 205,448,400 people shows a slight negative correlation between the proportion of Bulgarians and percentage of population with at least professional degree education in the United States with a correlation coefficient (R) of -0.082 and weighted average of 5.7%. Similarly, the statistical analysis conducted on geographies consisting of 323,812,210 people shows a perfect positive correlation between the proportion of Immigrants from Italy and percentage of population with at least professional degree education in the United States with a correlation coefficient (R) of 0.969 and weighted average of 5.2%, a difference of 9.9%.
Bulgarian vs Immigrants from Italy Professional Degree

Professional Degree Correlation Summary

MeasurementBulgarianImmigrants from Italy
Minimum0.51%1.5%
Maximum15.6%100.0%
Range15.1%98.5%
Mean4.9%9.6%
Median4.7%4.8%
Interquartile 25% (IQ1)3.1%4.4%
Interquartile 75% (IQ3)6.4%5.8%
Interquartile Range (IQR)3.3%1.4%
Standard Deviation (Sample)2.9%19.6%
Standard Deviation (Population)2.9%19.2%

Similar Demographics by Professional Degree

Demographics Similar to Bulgarians by Professional Degree

In terms of professional degree, the demographic groups most similar to Bulgarians are Immigrants from Europe (5.6%, a difference of 0.52%), South African (5.7%, a difference of 0.59%), Immigrants from Malaysia (5.7%, a difference of 0.86%), Bolivian (5.6%, a difference of 0.94%), and Immigrants from Western Europe (5.7%, a difference of 0.98%).
DemographicsRating | RankProfessional Degree
Immigrants | Greece
100.0
/100
|
#51
Exceptional
5.8%
Immigrants | Serbia
100.0
/100
|
#52
Exceptional
5.8%
Immigrants | Netherlands
100.0
/100
|
#53
Exceptional
5.8%
Immigrants | Kuwait
100.0
/100
|
#54
Exceptional
5.7%
Immigrants | Western Europe
100.0
/100
|
#55
Exceptional
5.7%
Immigrants | Malaysia
100.0
/100
|
#56
Exceptional
5.7%
South Africans
100.0
/100
|
#57
Exceptional
5.7%
Bulgarians
100.0
/100
|
#58
Exceptional
5.7%
Immigrants | Europe
100.0
/100
|
#59
Exceptional
5.6%
Bolivians
99.9
/100
|
#60
Exceptional
5.6%
Immigrants | Lithuania
99.9
/100
|
#61
Exceptional
5.6%
Immigrants | Belarus
99.9
/100
|
#62
Exceptional
5.5%
Asians
99.9
/100
|
#63
Exceptional
5.5%
Immigrants | Asia
99.9
/100
|
#64
Exceptional
5.5%
Immigrants | Bolivia
99.9
/100
|
#65
Exceptional
5.5%

Demographics Similar to Immigrants from Italy by Professional Degree

In terms of professional degree, the demographic groups most similar to Immigrants from Italy are Austrian (5.2%, a difference of 0.060%), Syrian (5.2%, a difference of 0.080%), Immigrants from Uzbekistan (5.2%, a difference of 0.43%), Ugandan (5.1%, a difference of 0.76%), and Zimbabwean (5.2%, a difference of 0.84%).
DemographicsRating | RankProfessional Degree
Immigrants | Eastern Europe
99.5
/100
|
#92
Exceptional
5.2%
Northern Europeans
99.3
/100
|
#93
Exceptional
5.2%
Alsatians
99.3
/100
|
#94
Exceptional
5.2%
Zimbabweans
99.3
/100
|
#95
Exceptional
5.2%
Immigrants | Uzbekistan
99.2
/100
|
#96
Exceptional
5.2%
Syrians
99.1
/100
|
#97
Exceptional
5.2%
Austrians
99.1
/100
|
#98
Exceptional
5.2%
Immigrants | Italy
99.1
/100
|
#99
Exceptional
5.2%
Ugandans
98.8
/100
|
#100
Exceptional
5.1%
Immigrants | Egypt
98.5
/100
|
#101
Exceptional
5.1%
Ukrainians
98.5
/100
|
#102
Exceptional
5.1%
Immigrants | Northern Africa
98.4
/100
|
#103
Exceptional
5.1%
Arabs
98.2
/100
|
#104
Exceptional
5.0%
Immigrants | Uganda
98.2
/100
|
#105
Exceptional
5.0%
Immigrants | Ukraine
98.2
/100
|
#106
Exceptional
5.0%