Bulgarian vs Immigrants from Honduras Kindergarten
COMPARE
Bulgarian
Immigrants from Honduras
Kindergarten
Kindergarten Comparison
Bulgarians
Immigrants from Honduras
98.4%
KINDERGARTEN
99.7/ 100
METRIC RATING
58th/ 347
METRIC RANK
96.8%
KINDERGARTEN
0.0/ 100
METRIC RATING
323rd/ 347
METRIC RANK
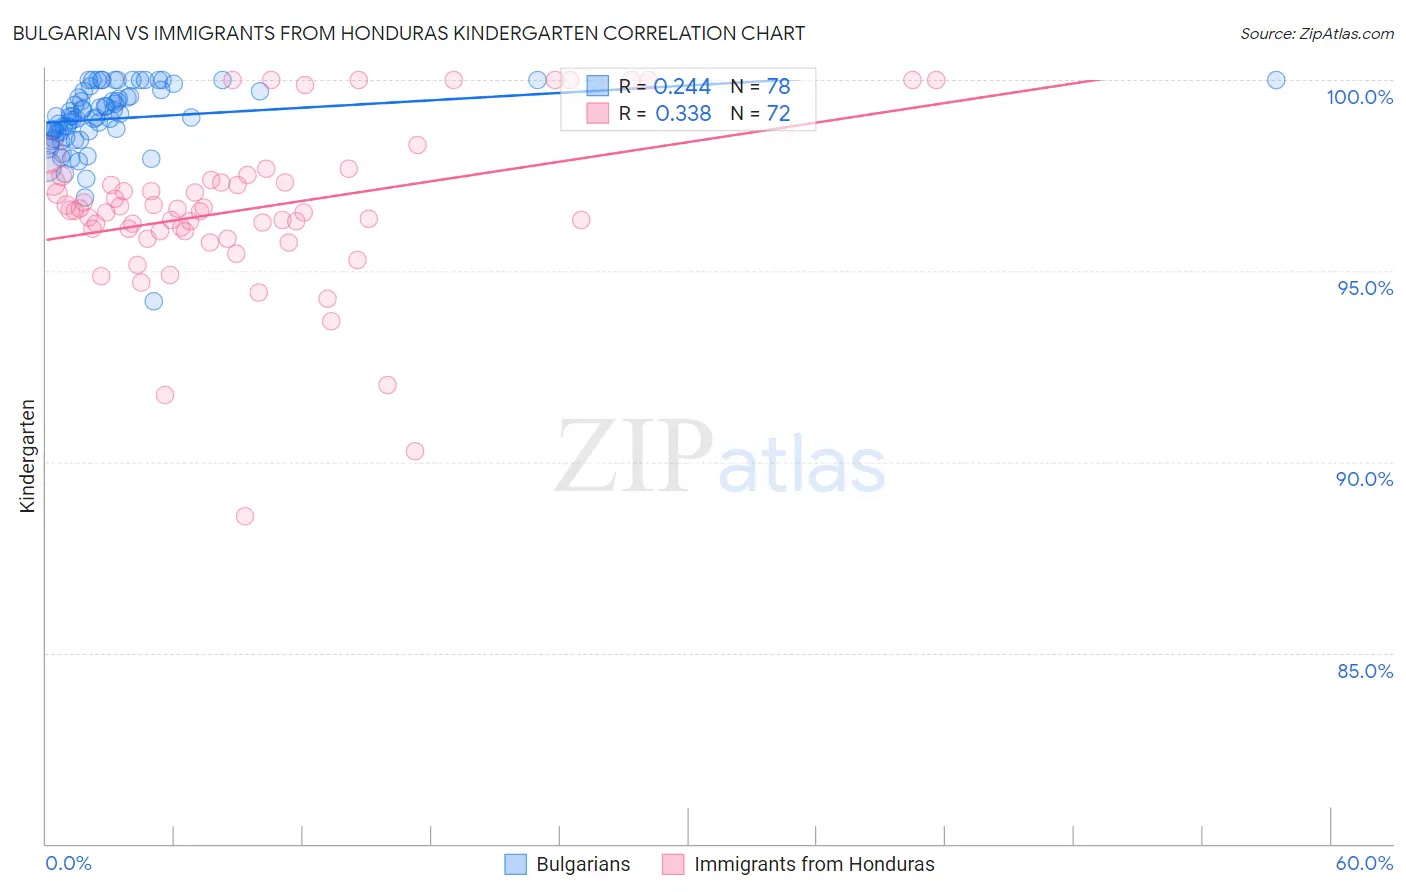
Bulgarian vs Immigrants from Honduras Kindergarten Correlation Chart
The statistical analysis conducted on geographies consisting of 205,633,223 people shows a weak positive correlation between the proportion of Bulgarians and percentage of population with at least kindergarten education in the United States with a correlation coefficient (R) of 0.244 and weighted average of 98.4%. Similarly, the statistical analysis conducted on geographies consisting of 322,637,445 people shows a mild positive correlation between the proportion of Immigrants from Honduras and percentage of population with at least kindergarten education in the United States with a correlation coefficient (R) of 0.338 and weighted average of 96.8%, a difference of 1.6%.
Kindergarten Correlation Summary
| Measurement | Bulgarian | Immigrants from Honduras |
| Minimum | 94.2% | 88.6% |
| Maximum | 100.0% | 100.0% |
| Range | 5.8% | 11.4% |
| Mean | 99.0% | 96.6% |
| Median | 99.1% | 96.6% |
| Interquartile 25% (IQ1) | 98.6% | 96.0% |
| Interquartile 75% (IQ3) | 99.7% | 97.4% |
| Interquartile Range (IQR) | 1.1% | 1.3% |
| Standard Deviation (Sample) | 0.92% | 2.1% |
| Standard Deviation (Population) | 0.91% | 2.1% |
Similar Demographics by Kindergarten
Demographics Similar to Bulgarians by Kindergarten
In terms of kindergarten, the demographic groups most similar to Bulgarians are American (98.4%, a difference of 0.0%), Austrian (98.4%, a difference of 0.0%), Immigrants from Canada (98.4%, a difference of 0.0%), Creek (98.4%, a difference of 0.0%), and Immigrants from Scotland (98.4%, a difference of 0.010%).
| Demographics | Rating | Rank | Kindergarten |
| Estonians | 99.8 /100 | #51 | Exceptional 98.4% |
| Australians | 99.8 /100 | #52 | Exceptional 98.4% |
| Celtics | 99.8 /100 | #53 | Exceptional 98.4% |
| Pueblo | 99.8 /100 | #54 | Exceptional 98.4% |
| Immigrants | Scotland | 99.8 /100 | #55 | Exceptional 98.4% |
| Americans | 99.8 /100 | #56 | Exceptional 98.4% |
| Austrians | 99.8 /100 | #57 | Exceptional 98.4% |
| Bulgarians | 99.7 /100 | #58 | Exceptional 98.4% |
| Immigrants | Canada | 99.7 /100 | #59 | Exceptional 98.4% |
| Creek | 99.7 /100 | #60 | Exceptional 98.4% |
| Slavs | 99.7 /100 | #61 | Exceptional 98.4% |
| New Zealanders | 99.7 /100 | #62 | Exceptional 98.4% |
| Immigrants | North America | 99.7 /100 | #63 | Exceptional 98.4% |
| Greeks | 99.7 /100 | #64 | Exceptional 98.4% |
| Maltese | 99.7 /100 | #65 | Exceptional 98.4% |
Demographics Similar to Immigrants from Honduras by Kindergarten
In terms of kindergarten, the demographic groups most similar to Immigrants from Honduras are Mexican American Indian (96.8%, a difference of 0.010%), Vietnamese (96.8%, a difference of 0.010%), Immigrants from Bangladesh (96.8%, a difference of 0.020%), Immigrants from Guyana (96.8%, a difference of 0.030%), and Immigrants from Burma/Myanmar (96.8%, a difference of 0.030%).
| Demographics | Rating | Rank | Kindergarten |
| Immigrants | Nicaragua | 0.0 /100 | #316 | Tragic 96.9% |
| Immigrants | Ecuador | 0.0 /100 | #317 | Tragic 96.9% |
| Immigrants | Laos | 0.0 /100 | #318 | Tragic 96.9% |
| Immigrants | Guyana | 0.0 /100 | #319 | Tragic 96.8% |
| Immigrants | Burma/Myanmar | 0.0 /100 | #320 | Tragic 96.8% |
| Immigrants | Bangladesh | 0.0 /100 | #321 | Tragic 96.8% |
| Mexican American Indians | 0.0 /100 | #322 | Tragic 96.8% |
| Immigrants | Honduras | 0.0 /100 | #323 | Tragic 96.8% |
| Vietnamese | 0.0 /100 | #324 | Tragic 96.8% |
| Indonesians | 0.0 /100 | #325 | Tragic 96.8% |
| Dominicans | 0.0 /100 | #326 | Tragic 96.8% |
| Mexicans | 0.0 /100 | #327 | Tragic 96.7% |
| Immigrants | Latin America | 0.0 /100 | #328 | Tragic 96.7% |
| Immigrants | Vietnam | 0.0 /100 | #329 | Tragic 96.7% |
| Japanese | 0.0 /100 | #330 | Tragic 96.7% |