British West Indian vs U.S. Virgin Islander Bachelor's Degree
COMPARE
British West Indian
U.S. Virgin Islander
Bachelor's Degree
Bachelor's Degree Comparison
British West Indians
U.S. Virgin Islanders
34.5%
BACHELOR'S DEGREE
2.5/ 100
METRIC RATING
239th/ 347
METRIC RANK
33.2%
BACHELOR'S DEGREE
0.7/ 100
METRIC RATING
253rd/ 347
METRIC RANK
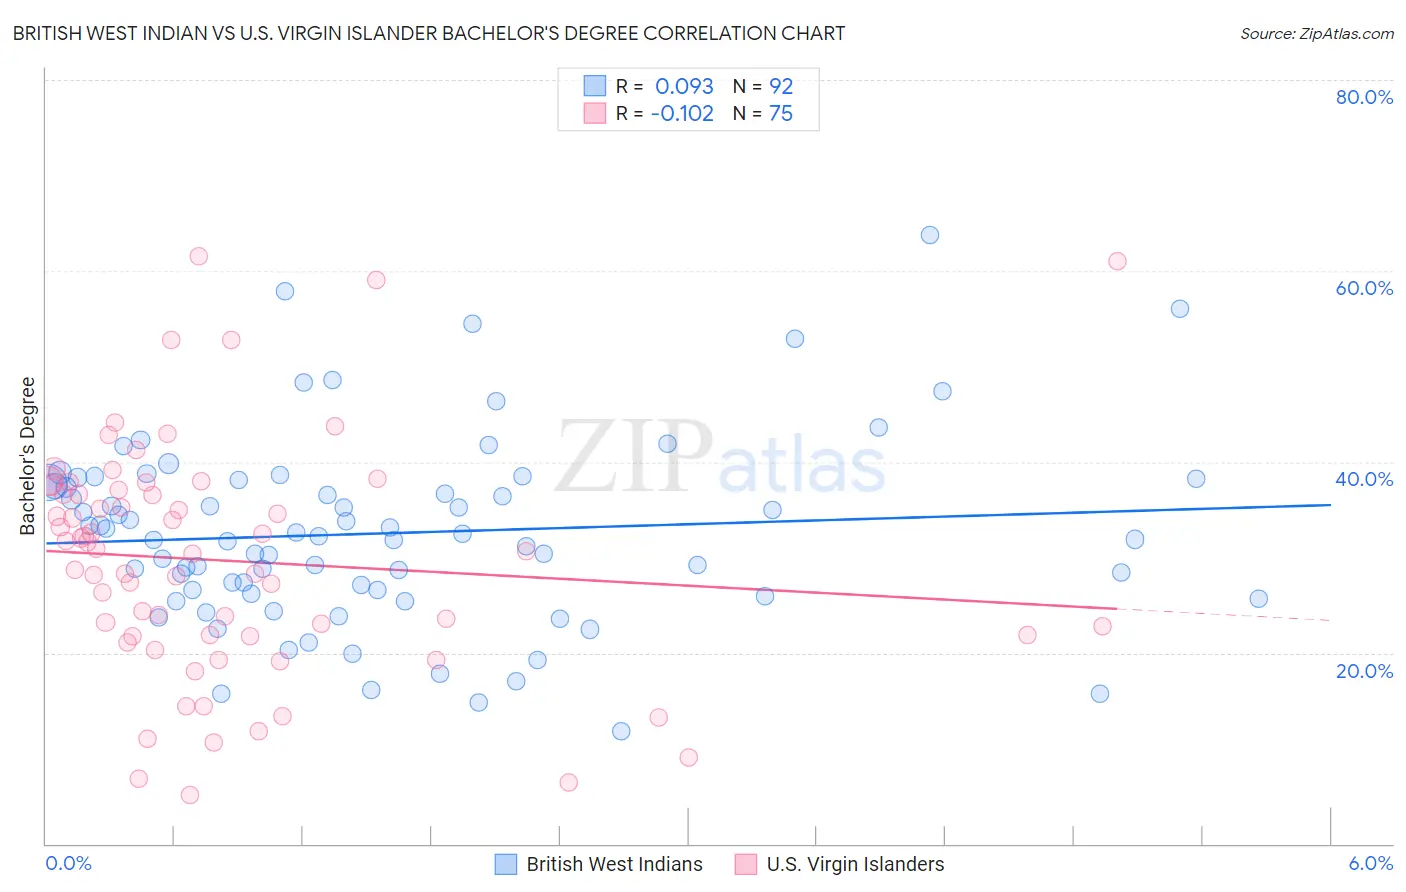
British West Indian vs U.S. Virgin Islander Bachelor's Degree Correlation Chart
The statistical analysis conducted on geographies consisting of 152,683,655 people shows a slight positive correlation between the proportion of British West Indians and percentage of population with at least bachelor's degree education in the United States with a correlation coefficient (R) of 0.093 and weighted average of 34.5%. Similarly, the statistical analysis conducted on geographies consisting of 87,527,119 people shows a poor negative correlation between the proportion of U.S. Virgin Islanders and percentage of population with at least bachelor's degree education in the United States with a correlation coefficient (R) of -0.102 and weighted average of 33.2%, a difference of 3.7%.
Bachelor's Degree Correlation Summary
| Measurement | British West Indian | U.S. Virgin Islander |
| Minimum | 11.8% | 5.1% |
| Maximum | 63.7% | 61.5% |
| Range | 51.9% | 56.4% |
| Mean | 32.5% | 29.6% |
| Median | 32.0% | 30.7% |
| Interquartile 25% (IQ1) | 26.4% | 21.7% |
| Interquartile 75% (IQ3) | 38.0% | 37.1% |
| Interquartile Range (IQR) | 11.6% | 15.4% |
| Standard Deviation (Sample) | 9.8% | 12.3% |
| Standard Deviation (Population) | 9.7% | 12.2% |
Demographics Similar to British West Indians and U.S. Virgin Islanders by Bachelor's Degree
In terms of bachelor's degree, the demographic groups most similar to British West Indians are Guyanese (34.5%, a difference of 0.020%), Tlingit-Haida (34.6%, a difference of 0.30%), Liberian (34.6%, a difference of 0.34%), Tongan (34.3%, a difference of 0.54%), and Immigrants from Cambodia (34.2%, a difference of 0.80%). Similarly, the demographic groups most similar to U.S. Virgin Islanders are Native Hawaiian (33.2%, a difference of 0.060%), Iroquois (33.2%, a difference of 0.080%), Immigrants from Bahamas (33.3%, a difference of 0.21%), Nicaraguan (33.1%, a difference of 0.27%), and Japanese (33.3%, a difference of 0.28%).
| Demographics | Rating | Rank | Bachelor's Degree |
| Liberians | 2.8 /100 | #236 | Tragic 34.6% |
| Tlingit-Haida | 2.8 /100 | #237 | Tragic 34.6% |
| Guyanese | 2.5 /100 | #238 | Tragic 34.5% |
| British West Indians | 2.5 /100 | #239 | Tragic 34.5% |
| Tongans | 2.0 /100 | #240 | Tragic 34.3% |
| Immigrants | Cambodia | 1.9 /100 | #241 | Tragic 34.2% |
| Immigrants | Nonimmigrants | 1.8 /100 | #242 | Tragic 34.2% |
| Immigrants | Guyana | 1.4 /100 | #243 | Tragic 33.9% |
| Delaware | 1.2 /100 | #244 | Tragic 33.8% |
| Immigrants | Fiji | 1.2 /100 | #245 | Tragic 33.7% |
| Jamaicans | 1.0 /100 | #246 | Tragic 33.6% |
| Immigrants | Congo | 1.0 /100 | #247 | Tragic 33.6% |
| Cree | 1.0 /100 | #248 | Tragic 33.6% |
| Immigrants | Liberia | 0.9 /100 | #249 | Tragic 33.5% |
| Indonesians | 0.9 /100 | #250 | Tragic 33.5% |
| Japanese | 0.7 /100 | #251 | Tragic 33.3% |
| Immigrants | Bahamas | 0.7 /100 | #252 | Tragic 33.3% |
| U.S. Virgin Islanders | 0.7 /100 | #253 | Tragic 33.2% |
| Native Hawaiians | 0.7 /100 | #254 | Tragic 33.2% |
| Iroquois | 0.7 /100 | #255 | Tragic 33.2% |
| Nicaraguans | 0.6 /100 | #256 | Tragic 33.1% |