British West Indian vs Panamanian No Schooling Completed
COMPARE
British West Indian
Panamanian
No Schooling Completed
No Schooling Completed Comparison
British West Indians
Panamanians
2.7%
NO SCHOOLING COMPLETED
0.0/ 100
METRIC RATING
291st/ 347
METRIC RANK
2.1%
NO SCHOOLING COMPLETED
45.2/ 100
METRIC RATING
176th/ 347
METRIC RANK
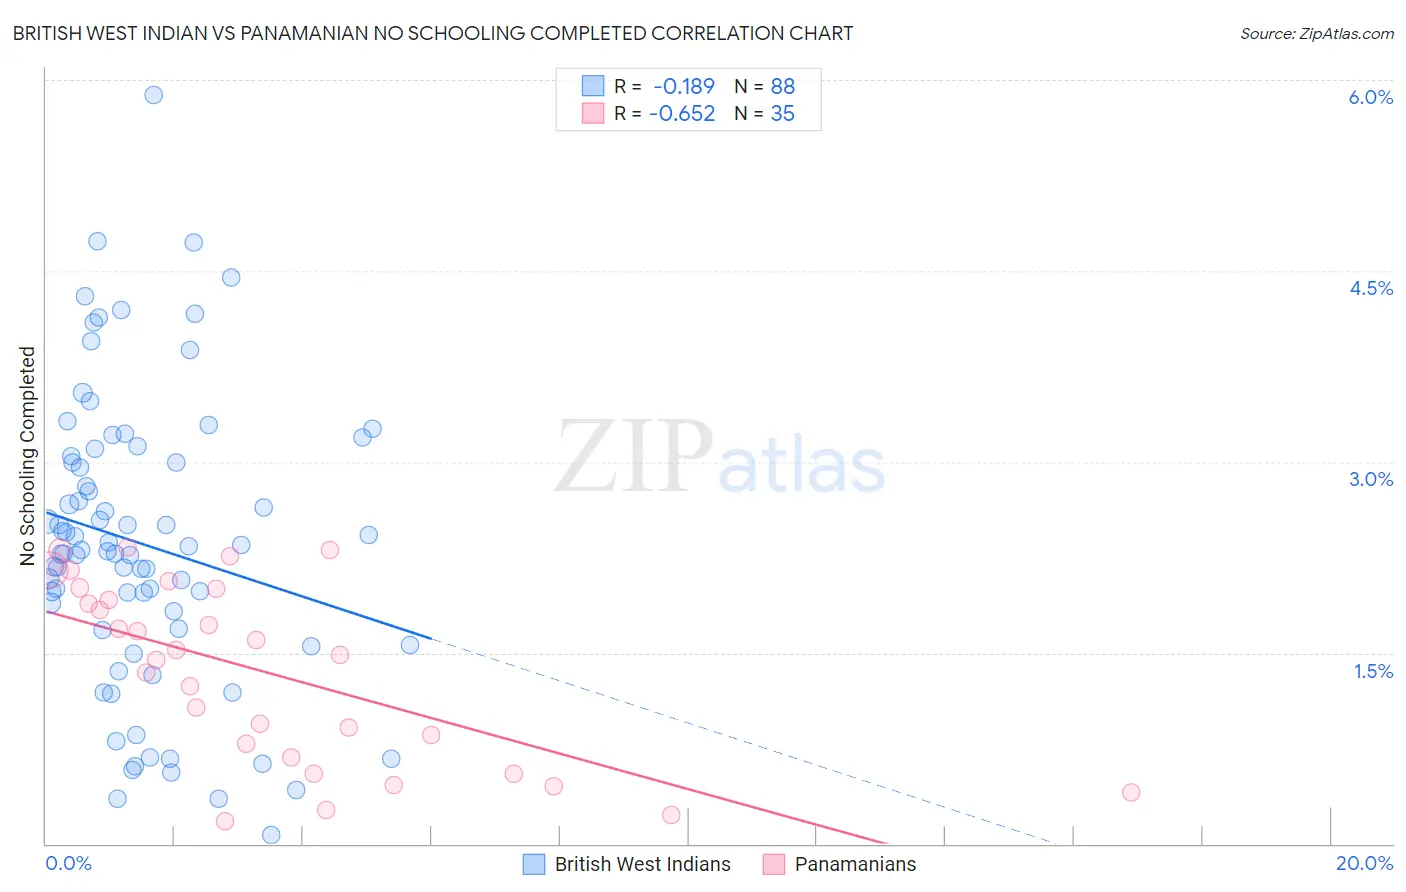
British West Indian vs Panamanian No Schooling Completed Correlation Chart
The statistical analysis conducted on geographies consisting of 152,295,928 people shows a poor negative correlation between the proportion of British West Indians and percentage of population with no schooling in the United States with a correlation coefficient (R) of -0.189 and weighted average of 2.7%. Similarly, the statistical analysis conducted on geographies consisting of 279,950,007 people shows a significant negative correlation between the proportion of Panamanians and percentage of population with no schooling in the United States with a correlation coefficient (R) of -0.652 and weighted average of 2.1%, a difference of 29.6%.
No Schooling Completed Correlation Summary
| Measurement | British West Indian | Panamanian |
| Minimum | 0.065% | 0.18% |
| Maximum | 5.9% | 2.3% |
| Range | 5.8% | 2.1% |
| Mean | 2.4% | 1.4% |
| Median | 2.3% | 1.5% |
| Interquartile 25% (IQ1) | 1.7% | 0.68% |
| Interquartile 75% (IQ3) | 3.0% | 2.0% |
| Interquartile Range (IQR) | 1.3% | 1.3% |
| Standard Deviation (Sample) | 1.1% | 0.70% |
| Standard Deviation (Population) | 1.1% | 0.69% |
Similar Demographics by No Schooling Completed
Demographics Similar to British West Indians by No Schooling Completed
In terms of no schooling completed, the demographic groups most similar to British West Indians are Immigrants from Hong Kong (2.7%, a difference of 0.89%), Immigrants from Thailand (2.7%, a difference of 0.95%), Immigrants from Grenada (2.8%, a difference of 1.1%), Immigrants from St. Vincent and the Grenadines (2.7%, a difference of 1.3%), and Immigrants from Afghanistan (2.7%, a difference of 1.4%).
| Demographics | Rating | Rank | No Schooling Completed |
| Immigrants | West Indies | 0.0 /100 | #284 | Tragic 2.7% |
| Immigrants | Barbados | 0.0 /100 | #285 | Tragic 2.7% |
| Immigrants | Portugal | 0.0 /100 | #286 | Tragic 2.7% |
| Immigrants | Afghanistan | 0.0 /100 | #287 | Tragic 2.7% |
| Immigrants | St. Vincent and the Grenadines | 0.0 /100 | #288 | Tragic 2.7% |
| Immigrants | Thailand | 0.0 /100 | #289 | Tragic 2.7% |
| Immigrants | Hong Kong | 0.0 /100 | #290 | Tragic 2.7% |
| British West Indians | 0.0 /100 | #291 | Tragic 2.7% |
| Immigrants | Grenada | 0.0 /100 | #292 | Tragic 2.8% |
| Malaysians | 0.0 /100 | #293 | Tragic 2.8% |
| Immigrants | Eritrea | 0.0 /100 | #294 | Tragic 2.8% |
| Houma | 0.0 /100 | #295 | Tragic 2.8% |
| Immigrants | Immigrants | 0.0 /100 | #296 | Tragic 2.8% |
| Immigrants | Cuba | 0.0 /100 | #297 | Tragic 2.8% |
| Immigrants | Dominica | 0.0 /100 | #298 | Tragic 2.8% |
Demographics Similar to Panamanians by No Schooling Completed
In terms of no schooling completed, the demographic groups most similar to Panamanians are Arapaho (2.1%, a difference of 0.020%), Pakistani (2.1%, a difference of 0.060%), Immigrants from Kazakhstan (2.1%, a difference of 0.11%), Arab (2.1%, a difference of 0.17%), and Portuguese (2.1%, a difference of 0.17%).
| Demographics | Rating | Rank | No Schooling Completed |
| Apache | 56.7 /100 | #169 | Average 2.1% |
| Argentineans | 56.0 /100 | #170 | Average 2.1% |
| Immigrants | Poland | 55.2 /100 | #171 | Average 2.1% |
| Immigrants | Argentina | 52.7 /100 | #172 | Average 2.1% |
| Immigrants | Belarus | 51.8 /100 | #173 | Average 2.1% |
| Immigrants | Micronesia | 50.0 /100 | #174 | Average 2.1% |
| Arabs | 46.4 /100 | #175 | Average 2.1% |
| Panamanians | 45.2 /100 | #176 | Average 2.1% |
| Arapaho | 45.0 /100 | #177 | Average 2.1% |
| Pakistanis | 44.7 /100 | #178 | Average 2.1% |
| Immigrants | Kazakhstan | 44.3 /100 | #179 | Average 2.1% |
| Portuguese | 43.9 /100 | #180 | Average 2.1% |
| Immigrants | Taiwan | 42.6 /100 | #181 | Average 2.1% |
| French American Indians | 42.2 /100 | #182 | Average 2.1% |
| Blacks/African Americans | 41.4 /100 | #183 | Average 2.1% |