British West Indian vs Immigrants from Hungary 10th Grade
COMPARE
British West Indian
Immigrants from Hungary
10th Grade
10th Grade Comparison
British West Indians
Immigrants from Hungary
91.8%
10TH GRADE
0.0/ 100
METRIC RATING
290th/ 347
METRIC RANK
94.4%
10TH GRADE
95.8/ 100
METRIC RATING
117th/ 347
METRIC RANK
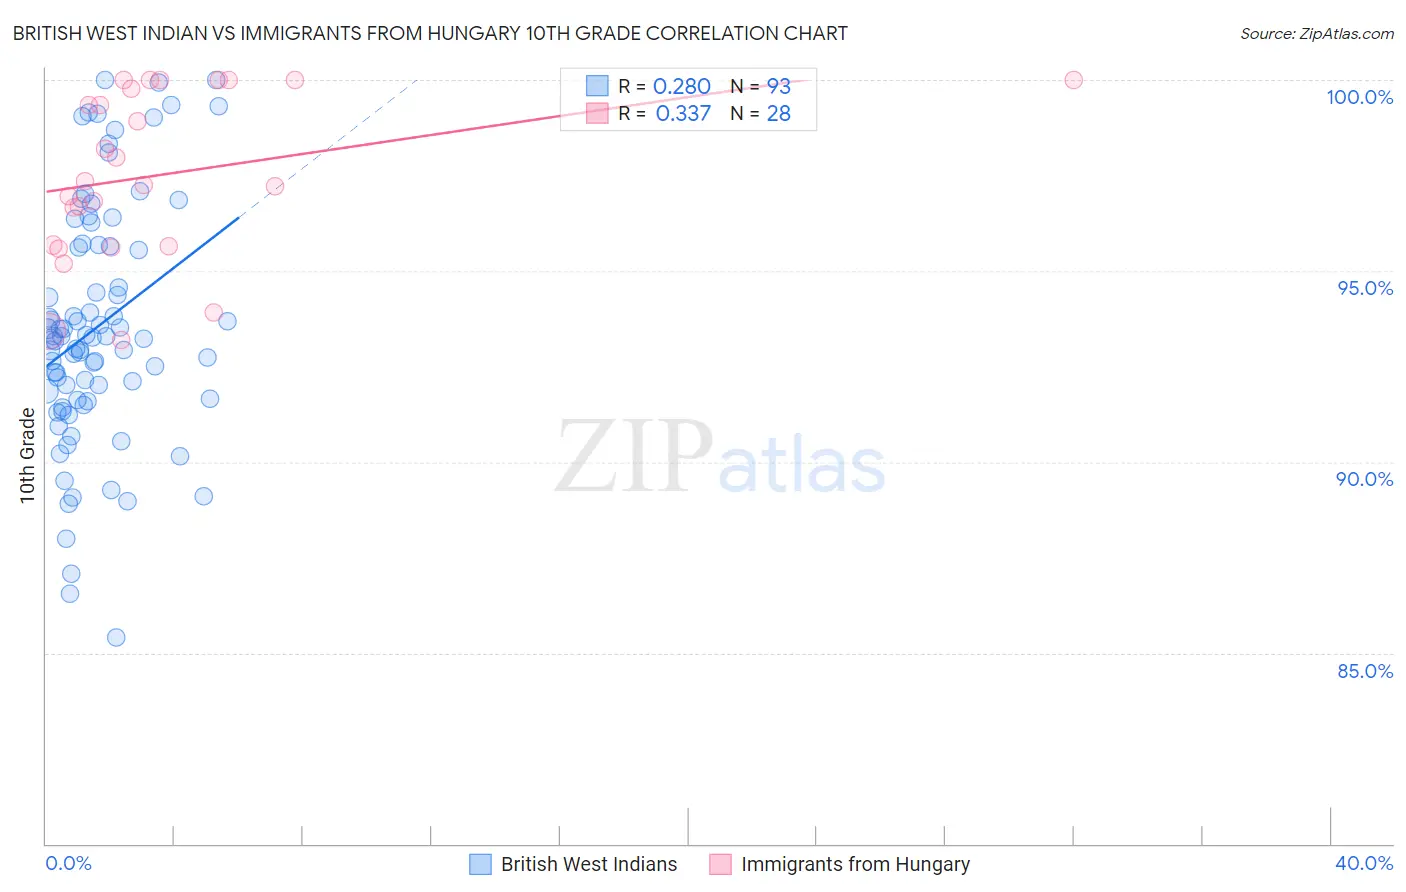
British West Indian vs Immigrants from Hungary 10th Grade Correlation Chart
The statistical analysis conducted on geographies consisting of 152,698,597 people shows a weak positive correlation between the proportion of British West Indians and percentage of population with at least 10th grade education in the United States with a correlation coefficient (R) of 0.280 and weighted average of 91.8%. Similarly, the statistical analysis conducted on geographies consisting of 195,707,305 people shows a mild positive correlation between the proportion of Immigrants from Hungary and percentage of population with at least 10th grade education in the United States with a correlation coefficient (R) of 0.337 and weighted average of 94.4%, a difference of 2.8%.
10th Grade Correlation Summary
| Measurement | British West Indian | Immigrants from Hungary |
| Minimum | 85.4% | 93.2% |
| Maximum | 100.0% | 100.0% |
| Range | 14.6% | 6.8% |
| Mean | 93.5% | 97.5% |
| Median | 93.2% | 97.3% |
| Interquartile 25% (IQ1) | 91.6% | 95.7% |
| Interquartile 75% (IQ3) | 95.7% | 99.9% |
| Interquartile Range (IQR) | 4.0% | 4.2% |
| Standard Deviation (Sample) | 3.2% | 2.2% |
| Standard Deviation (Population) | 3.1% | 2.1% |
Similar Demographics by 10th Grade
Demographics Similar to British West Indians by 10th Grade
In terms of 10th grade, the demographic groups most similar to British West Indians are Immigrants from West Indies (91.8%, a difference of 0.0%), Immigrants from Burma/Myanmar (91.8%, a difference of 0.010%), Sri Lankan (91.8%, a difference of 0.020%), Indonesian (91.8%, a difference of 0.030%), and Pennsylvania German (91.9%, a difference of 0.060%).
| Demographics | Rating | Rank | 10th Grade |
| Immigrants | St. Vincent and the Grenadines | 0.0 /100 | #283 | Tragic 92.1% |
| Immigrants | Barbados | 0.0 /100 | #284 | Tragic 92.1% |
| Immigrants | South Eastern Asia | 0.0 /100 | #285 | Tragic 92.1% |
| Yuman | 0.0 /100 | #286 | Tragic 92.0% |
| Pennsylvania Germans | 0.0 /100 | #287 | Tragic 91.9% |
| Immigrants | Laos | 0.0 /100 | #288 | Tragic 91.9% |
| Sri Lankans | 0.0 /100 | #289 | Tragic 91.8% |
| British West Indians | 0.0 /100 | #290 | Tragic 91.8% |
| Immigrants | West Indies | 0.0 /100 | #291 | Tragic 91.8% |
| Immigrants | Burma/Myanmar | 0.0 /100 | #292 | Tragic 91.8% |
| Indonesians | 0.0 /100 | #293 | Tragic 91.8% |
| Haitians | 0.0 /100 | #294 | Tragic 91.8% |
| Lumbee | 0.0 /100 | #295 | Tragic 91.7% |
| Immigrants | Grenada | 0.0 /100 | #296 | Tragic 91.6% |
| Fijians | 0.0 /100 | #297 | Tragic 91.5% |
Demographics Similar to Immigrants from Hungary by 10th Grade
In terms of 10th grade, the demographic groups most similar to Immigrants from Hungary are Jordanian (94.4%, a difference of 0.010%), Immigrants from Israel (94.4%, a difference of 0.020%), German Russian (94.4%, a difference of 0.030%), Delaware (94.4%, a difference of 0.030%), and Sioux (94.4%, a difference of 0.030%).
| Demographics | Rating | Rank | 10th Grade |
| Burmese | 97.1 /100 | #110 | Exceptional 94.5% |
| Immigrants | Zimbabwe | 96.8 /100 | #111 | Exceptional 94.4% |
| Immigrants | Kuwait | 96.8 /100 | #112 | Exceptional 94.4% |
| Palestinians | 96.5 /100 | #113 | Exceptional 94.4% |
| German Russians | 96.3 /100 | #114 | Exceptional 94.4% |
| Delaware | 96.3 /100 | #115 | Exceptional 94.4% |
| Sioux | 96.2 /100 | #116 | Exceptional 94.4% |
| Immigrants | Hungary | 95.8 /100 | #117 | Exceptional 94.4% |
| Jordanians | 95.6 /100 | #118 | Exceptional 94.4% |
| Immigrants | Israel | 95.4 /100 | #119 | Exceptional 94.4% |
| Immigrants | Taiwan | 95.3 /100 | #120 | Exceptional 94.4% |
| Immigrants | Belarus | 95.2 /100 | #121 | Exceptional 94.4% |
| Inupiat | 95.1 /100 | #122 | Exceptional 94.4% |
| Cree | 95.1 /100 | #123 | Exceptional 94.4% |
| Basques | 94.9 /100 | #124 | Exceptional 94.3% |