British vs Immigrants from Germany No Schooling Completed
COMPARE
British
Immigrants from Germany
No Schooling Completed
No Schooling Completed Comparison
British
Immigrants from Germany
1.5%
NO SCHOOLING COMPLETED
100.0/ 100
METRIC RATING
30th/ 347
METRIC RANK
1.8%
NO SCHOOLING COMPLETED
99.0/ 100
METRIC RATING
91st/ 347
METRIC RANK
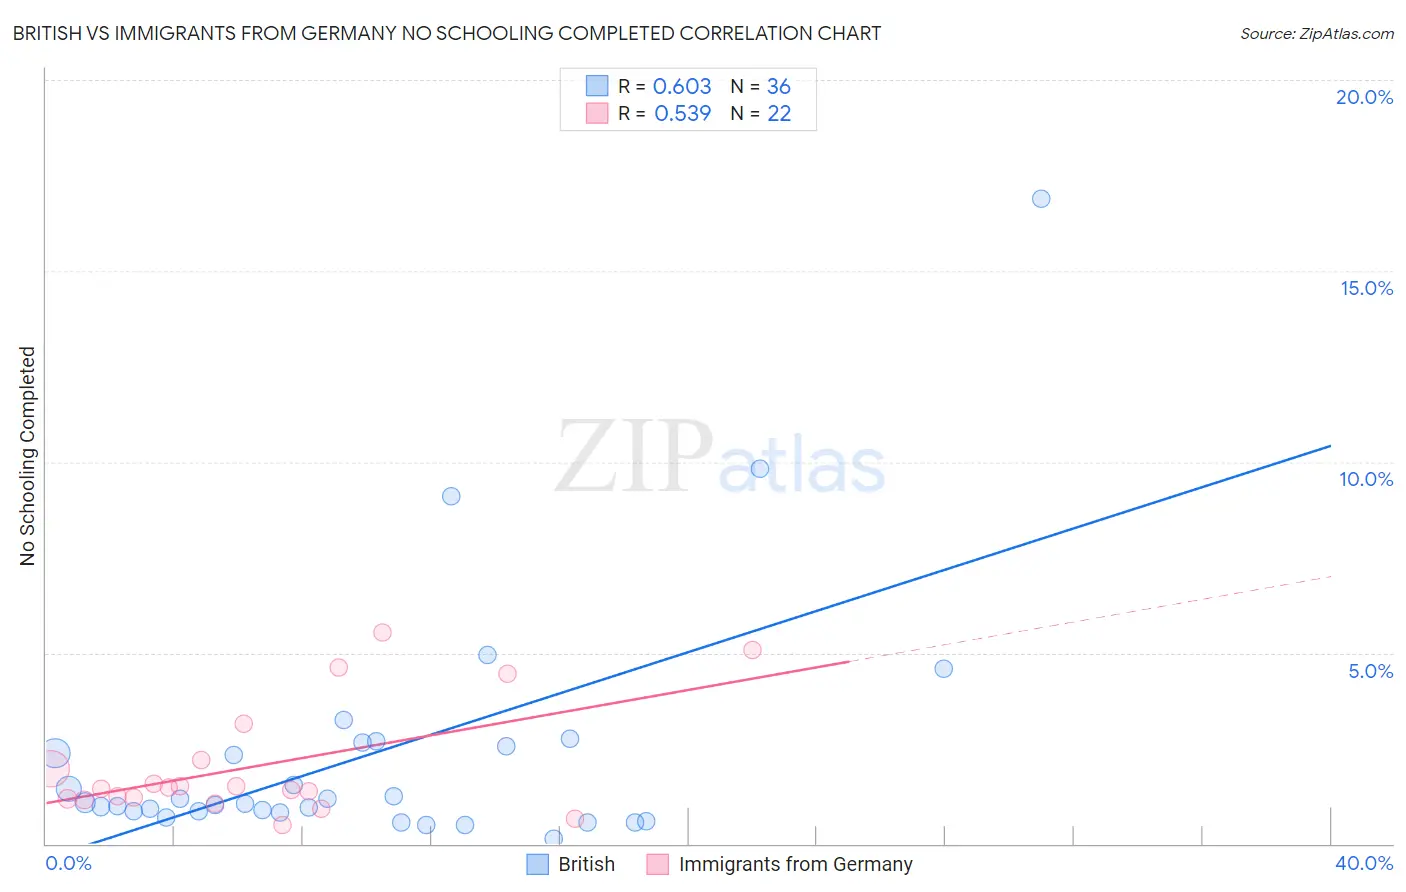
British vs Immigrants from Germany No Schooling Completed Correlation Chart
The statistical analysis conducted on geographies consisting of 518,649,413 people shows a significant positive correlation between the proportion of British and percentage of population with no schooling in the United States with a correlation coefficient (R) of 0.603 and weighted average of 1.5%. Similarly, the statistical analysis conducted on geographies consisting of 457,031,521 people shows a substantial positive correlation between the proportion of Immigrants from Germany and percentage of population with no schooling in the United States with a correlation coefficient (R) of 0.539 and weighted average of 1.8%, a difference of 16.5%.
No Schooling Completed Correlation Summary
| Measurement | British | Immigrants from Germany |
| Minimum | 0.14% | 0.48% |
| Maximum | 16.9% | 5.5% |
| Range | 16.8% | 5.1% |
| Mean | 2.4% | 2.0% |
| Median | 1.1% | 1.5% |
| Interquartile 25% (IQ1) | 0.83% | 1.2% |
| Interquartile 75% (IQ3) | 2.6% | 2.2% |
| Interquartile Range (IQR) | 1.8% | 1.0% |
| Standard Deviation (Sample) | 3.3% | 1.5% |
| Standard Deviation (Population) | 3.3% | 1.5% |
Similar Demographics by No Schooling Completed
Demographics Similar to British by No Schooling Completed
In terms of no schooling completed, the demographic groups most similar to British are Inupiat (1.5%, a difference of 0.030%), Swiss (1.5%, a difference of 0.42%), Lumbee (1.5%, a difference of 0.48%), Italian (1.5%, a difference of 1.1%), and Latvian (1.5%, a difference of 1.4%).
| Demographics | Rating | Rank | No Schooling Completed |
| Europeans | 100.0 /100 | #23 | Exceptional 1.5% |
| Pennsylvania Germans | 100.0 /100 | #24 | Exceptional 1.5% |
| French | 100.0 /100 | #25 | Exceptional 1.5% |
| Czechs | 100.0 /100 | #26 | Exceptional 1.5% |
| Scandinavians | 100.0 /100 | #27 | Exceptional 1.5% |
| French Canadians | 100.0 /100 | #28 | Exceptional 1.5% |
| Lumbee | 100.0 /100 | #29 | Exceptional 1.5% |
| British | 100.0 /100 | #30 | Exceptional 1.5% |
| Inupiat | 100.0 /100 | #31 | Exceptional 1.5% |
| Swiss | 100.0 /100 | #32 | Exceptional 1.5% |
| Italians | 100.0 /100 | #33 | Exceptional 1.5% |
| Latvians | 100.0 /100 | #34 | Exceptional 1.5% |
| Eastern Europeans | 100.0 /100 | #35 | Exceptional 1.6% |
| Aleuts | 99.9 /100 | #36 | Exceptional 1.6% |
| Belgians | 99.9 /100 | #37 | Exceptional 1.6% |
Demographics Similar to Immigrants from Germany by No Schooling Completed
In terms of no schooling completed, the demographic groups most similar to Immigrants from Germany are Sioux (1.8%, a difference of 0.11%), Romanian (1.8%, a difference of 0.52%), South African (1.8%, a difference of 0.82%), Immigrants from Western Europe (1.8%, a difference of 0.86%), and Turkish (1.8%, a difference of 0.89%).
| Demographics | Rating | Rank | No Schooling Completed |
| Immigrants | Denmark | 99.2 /100 | #84 | Exceptional 1.7% |
| Immigrants | Australia | 99.2 /100 | #85 | Exceptional 1.7% |
| Ukrainians | 99.2 /100 | #86 | Exceptional 1.8% |
| Osage | 99.2 /100 | #87 | Exceptional 1.8% |
| Immigrants | Western Europe | 99.2 /100 | #88 | Exceptional 1.8% |
| South Africans | 99.1 /100 | #89 | Exceptional 1.8% |
| Sioux | 99.0 /100 | #90 | Exceptional 1.8% |
| Immigrants | Germany | 99.0 /100 | #91 | Exceptional 1.8% |
| Romanians | 98.8 /100 | #92 | Exceptional 1.8% |
| Turks | 98.7 /100 | #93 | Exceptional 1.8% |
| Immigrants | Nonimmigrants | 98.5 /100 | #94 | Exceptional 1.8% |
| Puget Sound Salish | 98.5 /100 | #95 | Exceptional 1.8% |
| Bhutanese | 98.4 /100 | #96 | Exceptional 1.8% |
| Immigrants | Ireland | 98.4 /100 | #97 | Exceptional 1.8% |
| Iranians | 98.2 /100 | #98 | Exceptional 1.8% |