Brazilian vs Immigrants from Eritrea 6th Grade

COMPARE

Brazilian
Race
Ancestry
AfghanAfricanAlaska NativeAlaskan AthabascanAlbanianAleutAlsatianAmericanApacheArabArapahoArgentineanArmenianAssyrian/Chaldean/SyriacAustralianAustrianBahamianBangladeshiBarbadianBasqueBelgianBelizeanBermudanBhutaneseBlackfeetBolivianBrazilianBritishBritish West IndianBulgarianBurmeseCajunCambodianCanadianCape VerdeanCarpatho RusynCelticCentral AmericanCentral American IndianCherokeeCheyenneChickasawChileanChineseChippewaChoctawColombianColvilleComancheCosta RicanCreeCreekCroatianCrowCubanCypriotCzechCzechoslovakianDanishDelawareDominicanDutchDutch West IndianEastern EuropeanEcuadorianEgyptianEnglishEstonianEthiopianEuropeanFijianFilipinoFinnishFrenchFrench American IndianFrench CanadianGermanGerman RussianGhanaianGreekGuamanian/ChamorroGuatemalanGuyaneseHaitianHmongHonduranHopiHoumaHungarianIcelanderIndian (Asian)IndonesianInupiatIranianIraqiIrishIroquoisIsraeliItalianJamaicanJapaneseJordanianKenyanKiowaKoreanLaotianLatvianLebaneseLiberianLithuanianLumbeeLuxembourgerMacedonianMalaysianMalteseMarshalleseMenomineeMexicanMexican American IndianMongolianMoroccanNative HawaiianNavajoNepaleseNew ZealanderNicaraguanNigerianNorthern EuropeanNorwegianOkinawanOsageOttawaPaiutePakistaniPalestinianPanamanianParaguayanPennsylvania GermanPeruvianPimaPolishPortuguesePotawatomiPuebloPuerto RicanPuget Sound SalishRomanianRussianSalvadoranSamoanScandinavianScotch-IrishScottishSeminoleSenegaleseSerbianShoshoneSierra LeoneanSiouxSlavicSlovakSloveneSomaliSouth AfricanSouth AmericanSouth American IndianSoviet UnionSpaniardSpanishSpanish AmericanSpanish American IndianSri LankanSubsaharan AfricanSudaneseSwedishSwissSyrianTaiwaneseThaiTlingit-HaidaTohono O'OdhamTonganTrinidadian and TobagonianTsimshianTurkishU.S. Virgin IslanderUgandanUkrainianUruguayanUteVenezuelanVietnameseWelshWest IndianYakamaYaquiYugoslavianYumanYup'ikZimbabwean
Immigration
NonimmigrantsImmigrantsAfghanistanAfricaAlbaniaArgentinaArmeniaAsiaAustraliaAustriaBahamasBangladeshBarbadosBelarusBelgiumBelizeBoliviaBosnia and HerzegovinaBrazilBulgariaBurma/MyanmarCabo VerdeCambodiaCameroonCanadaCaribbeanCentral AmericaChileChinaColombiaCongoCosta RicaCroatiaCubaCzechoslovakiaDenmarkDominicaDominican RepublicEastern AfricaEastern AsiaEastern EuropeEcuadorEgyptEl SalvadorEnglandEthiopiaEuropeFijiFranceGermanyGhanaGreeceGrenadaGuatemalaGuyanaHaitiHondurasHong KongHungaryIndiaIndonesiaIranIraqIrelandIsraelItalyJamaicaJapanJordanKazakhstanKenyaKoreaKuwaitLaosLatin AmericaLatviaLebanonLiberiaLithuaniaMalaysiaMexicoMicronesiaMiddle AfricaMoldovaMoroccoNepalNetherlandsNicaraguaNigeriaNorth AmericaNorth MacedoniaNorthern AfricaNorthern EuropeNorwayOceaniaPakistanPanamaPeruPhilippinesPolandPortugalRomaniaRussiaSaudi ArabiaScotlandSenegalSerbiaSierra LeoneSingaporeSomaliaSouth AfricaSouth AmericaSouth Central AsiaSouth Eastern AsiaSouthern EuropeSpainSri LankaSt. Vincent and the GrenadinesSudanSwedenSwitzerlandSyriaTaiwanThailandTrinidad and TobagoTurkeyUgandaUkraineUruguayUzbekistanVenezuelaVietnamWest IndiesWestern AfricaWestern AsiaWestern EuropeYemenZaireZimbabweAzores
Immigrants from Eritrea
Race
Ancestry
AfghanAfricanAlaska NativeAlaskan AthabascanAlbanianAleutAlsatianAmericanApacheArabArapahoArgentineanArmenianAssyrian/Chaldean/SyriacAustralianAustrianBahamianBangladeshiBarbadianBasqueBelgianBelizeanBermudanBhutaneseBlackfeetBolivianBritishBritish West IndianBulgarianBurmeseCajunCambodianCanadianCape VerdeanCarpatho RusynCelticCentral AmericanCentral American IndianCherokeeCheyenneChickasawChileanChineseChippewaChoctawColombianColvilleComancheCosta RicanCreeCreekCroatianCrowCubanCypriotCzechCzechoslovakianDanishDelawareDominicanDutchDutch West IndianEastern EuropeanEcuadorianEgyptianEnglishEstonianEthiopianEuropeanFijianFilipinoFinnishFrenchFrench American IndianFrench CanadianGermanGerman RussianGhanaianGreekGuamanian/ChamorroGuatemalanGuyaneseHaitianHmongHonduranHopiHoumaHungarianIcelanderIndian (Asian)IndonesianInupiatIranianIraqiIrishIroquoisIsraeliItalianJamaicanJapaneseJordanianKenyanKiowaKoreanLaotianLatvianLebaneseLiberianLithuanianLumbeeLuxembourgerMacedonianMalaysianMalteseMarshalleseMenomineeMexicanMexican American IndianMongolianMoroccanNative HawaiianNavajoNepaleseNew ZealanderNicaraguanNigerianNorthern EuropeanNorwegianOkinawanOsageOttawaPaiutePakistaniPalestinianPanamanianParaguayanPennsylvania GermanPeruvianPimaPolishPortuguesePotawatomiPuebloPuerto RicanPuget Sound SalishRomanianRussianSalvadoranSamoanScandinavianScotch-IrishScottishSeminoleSenegaleseSerbianShoshoneSierra LeoneanSiouxSlavicSlovakSloveneSomaliSouth AfricanSouth AmericanSouth American IndianSoviet UnionSpaniardSpanishSpanish AmericanSpanish American IndianSri LankanSubsaharan AfricanSudaneseSwedishSwissSyrianTaiwaneseThaiTlingit-HaidaTohono O'OdhamTonganTrinidadian and TobagonianTsimshianTurkishU.S. Virgin IslanderUgandanUkrainianUruguayanUteVenezuelanVietnameseWelshWest IndianYakamaYaquiYugoslavianYumanYup'ikZimbabwean
Immigration
NonimmigrantsImmigrantsAfghanistanAfricaAlbaniaArgentinaArmeniaAsiaAustraliaAustriaBahamasBangladeshBarbadosBelarusBelgiumBelizeBoliviaBosnia and HerzegovinaBrazilBulgariaBurma/MyanmarCabo VerdeCambodiaCameroonCanadaCaribbeanCentral AmericaChileChinaColombiaCongoCosta RicaCroatiaCubaCzechoslovakiaDenmarkDominicaDominican RepublicEastern AfricaEastern AsiaEastern EuropeEcuadorEgyptEl SalvadorEnglandEritreaEthiopiaEuropeFijiFranceGermanyGhanaGreeceGrenadaGuatemalaGuyanaHaitiHondurasHong KongHungaryIndiaIndonesiaIranIraqIrelandIsraelItalyJamaicaJapanJordanKazakhstanKenyaKoreaKuwaitLaosLatin AmericaLatviaLebanonLiberiaLithuaniaMalaysiaMexicoMicronesiaMiddle AfricaMoldovaMoroccoNepalNetherlandsNicaraguaNigeriaNorth AmericaNorth MacedoniaNorthern AfricaNorthern EuropeNorwayOceaniaPakistanPanamaPeruPhilippinesPolandPortugalRomaniaRussiaSaudi ArabiaScotlandSenegalSerbiaSierra LeoneSingaporeSomaliaSouth AfricaSouth AmericaSouth Central AsiaSouth Eastern AsiaSouthern EuropeSpainSri LankaSt. Vincent and the GrenadinesSudanSwedenSwitzerlandSyriaTaiwanThailandTrinidad and TobagoTurkeyUgandaUkraineUruguayUzbekistanVenezuelaVietnamWest IndiesWestern AfricaWestern AsiaWestern EuropeYemenZaireZimbabweAzores
6th Grade
Income
Poverty
Unemployment
Labor Participation
Family Structure
Vehicle Availability
Education Level
Disability

6th Grade Comparison

Brazilians

Immigrants from Eritrea

Fair
Tragic
96.9%
6TH GRADE
20.1/ 100
METRIC RATING
197th/ 347
METRIC RANK
96.1%
6TH GRADE
0.0/ 100
METRIC RATING
289th/ 347
METRIC RANK

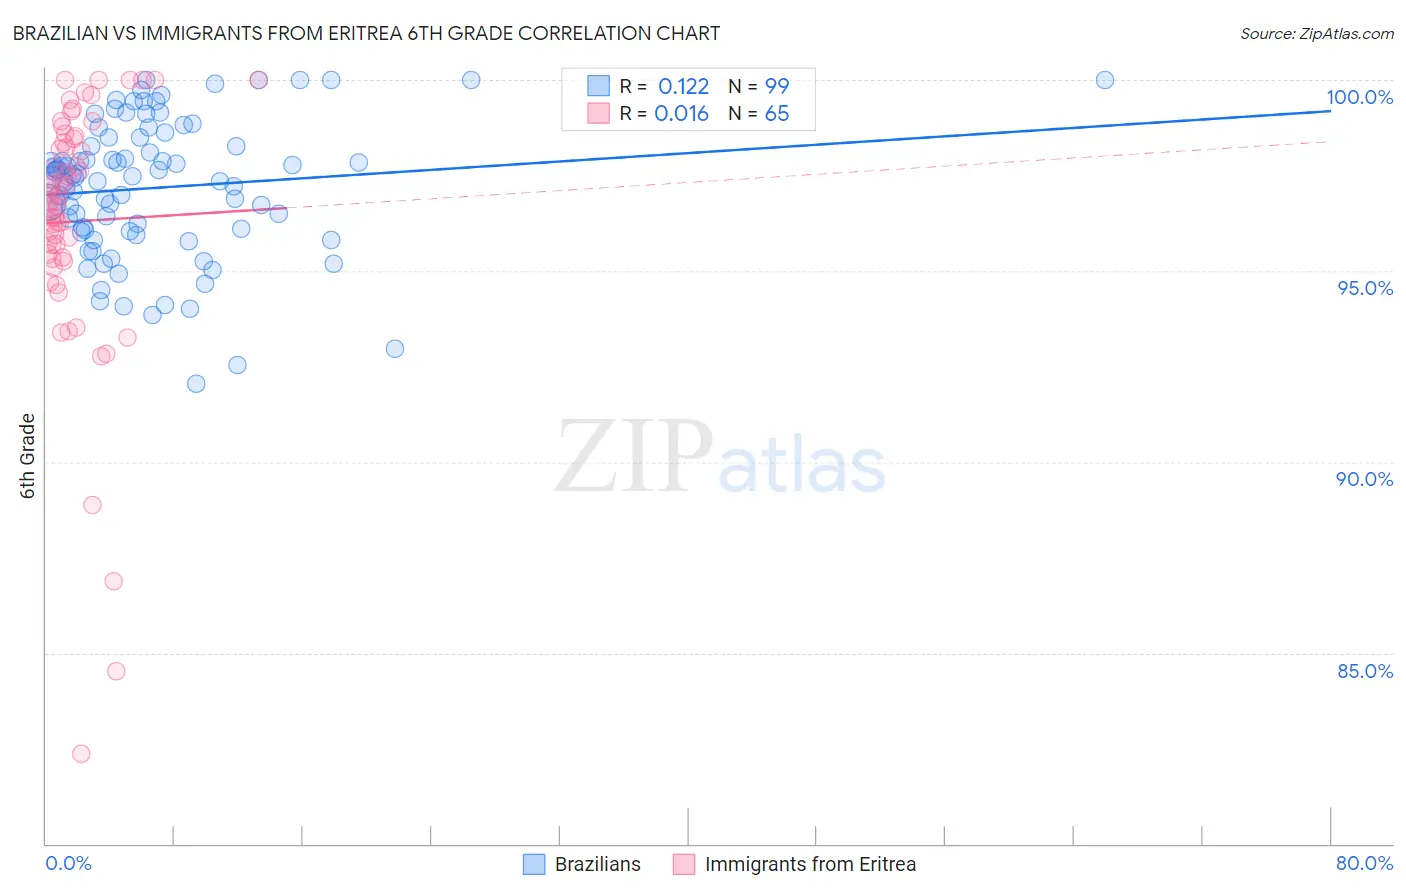
Brazilian vs Immigrants from Eritrea 6th Grade Correlation Chart

The statistical analysis conducted on geographies consisting of 323,962,626 people shows a poor positive correlation between the proportion of Brazilians and percentage of population with at least 6th grade education in the United States with a correlation coefficient (R) of 0.122 and weighted average of 96.9%. Similarly, the statistical analysis conducted on geographies consisting of 104,764,182 people shows no correlation between the proportion of Immigrants from Eritrea and percentage of population with at least 6th grade education in the United States with a correlation coefficient (R) of 0.016 and weighted average of 96.1%, a difference of 0.79%.
Brazilian vs Immigrants from Eritrea 6th Grade

6th Grade Correlation Summary

MeasurementBrazilianImmigrants from Eritrea
Minimum92.0%82.4%
Maximum100.0%100.0%
Range8.0%17.6%
Mean97.2%96.3%
Median97.5%96.8%
Interquartile 25% (IQ1)96.0%95.3%
Interquartile 75% (IQ3)98.5%98.5%
Interquartile Range (IQR)2.5%3.2%
Standard Deviation (Sample)1.8%3.4%
Standard Deviation (Population)1.8%3.4%

Similar Demographics by 6th Grade

Demographics Similar to Brazilians by 6th Grade

In terms of 6th grade, the demographic groups most similar to Brazilians are Immigrants from Uganda (96.9%, a difference of 0.010%), Immigrants from Albania (96.9%, a difference of 0.010%), Immigrants from Northern Africa (96.9%, a difference of 0.030%), Hawaiian (96.9%, a difference of 0.040%), and Paraguayan (96.9%, a difference of 0.040%).
DemographicsRating | Rank6th Grade
Dutch West Indians
28.3
/100
|
#190
Fair
96.9%
Panamanians
27.3
/100
|
#191
Fair
96.9%
Hawaiians
27.0
/100
|
#192
Fair
96.9%
Paraguayans
26.6
/100
|
#193
Fair
96.9%
Immigrants | Lebanon
25.6
/100
|
#194
Fair
96.9%
Immigrants | Brazil
25.5
/100
|
#195
Fair
96.9%
Immigrants | Uganda
21.2
/100
|
#196
Fair
96.9%
Brazilians
20.1
/100
|
#197
Fair
96.9%
Immigrants | Albania
18.8
/100
|
#198
Poor
96.9%
Immigrants | Northern Africa
15.7
/100
|
#199
Poor
96.9%
Africans
14.8
/100
|
#200
Poor
96.9%
Immigrants | Zaire
14.5
/100
|
#201
Poor
96.9%
Immigrants | Chile
14.2
/100
|
#202
Poor
96.8%
Sudanese
13.9
/100
|
#203
Poor
96.8%
Immigrants | Bahamas
13.8
/100
|
#204
Poor
96.8%

Demographics Similar to Immigrants from Eritrea by 6th Grade

In terms of 6th grade, the demographic groups most similar to Immigrants from Eritrea are Malaysian (96.2%, a difference of 0.020%), Immigrants from Somalia (96.1%, a difference of 0.020%), Immigrants from St. Vincent and the Grenadines (96.1%, a difference of 0.020%), Immigrants from Trinidad and Tobago (96.2%, a difference of 0.030%), and Barbadian (96.2%, a difference of 0.040%).
DemographicsRating | Rank6th Grade
Houma
0.1
/100
|
#282
Tragic
96.2%
Cubans
0.1
/100
|
#283
Tragic
96.2%
Fijians
0.1
/100
|
#284
Tragic
96.2%
Somalis
0.1
/100
|
#285
Tragic
96.2%
Barbadians
0.0
/100
|
#286
Tragic
96.2%
Immigrants | Trinidad and Tobago
0.0
/100
|
#287
Tragic
96.2%
Malaysians
0.0
/100
|
#288
Tragic
96.2%
Immigrants | Eritrea
0.0
/100
|
#289
Tragic
96.1%
Immigrants | Somalia
0.0
/100
|
#290
Tragic
96.1%
Immigrants | St. Vincent and the Grenadines
0.0
/100
|
#291
Tragic
96.1%
Immigrants | Barbados
0.0
/100
|
#292
Tragic
96.1%
Immigrants | West Indies
0.0
/100
|
#293
Tragic
96.1%
British West Indians
0.0
/100
|
#294
Tragic
96.0%
Immigrants | Grenada
0.0
/100
|
#295
Tragic
95.9%
Immigrants | South Eastern Asia
0.0
/100
|
#296
Tragic
95.9%