Brazilian vs Immigrants from Ecuador Associate's Degree
COMPARE
Brazilian
Immigrants from Ecuador
Associate's Degree
Associate's Degree Comparison
Brazilians
Immigrants from Ecuador
48.7%
ASSOCIATE'S DEGREE
93.7/ 100
METRIC RATING
123rd/ 347
METRIC RANK
42.2%
ASSOCIATE'S DEGREE
0.8/ 100
METRIC RATING
248th/ 347
METRIC RANK
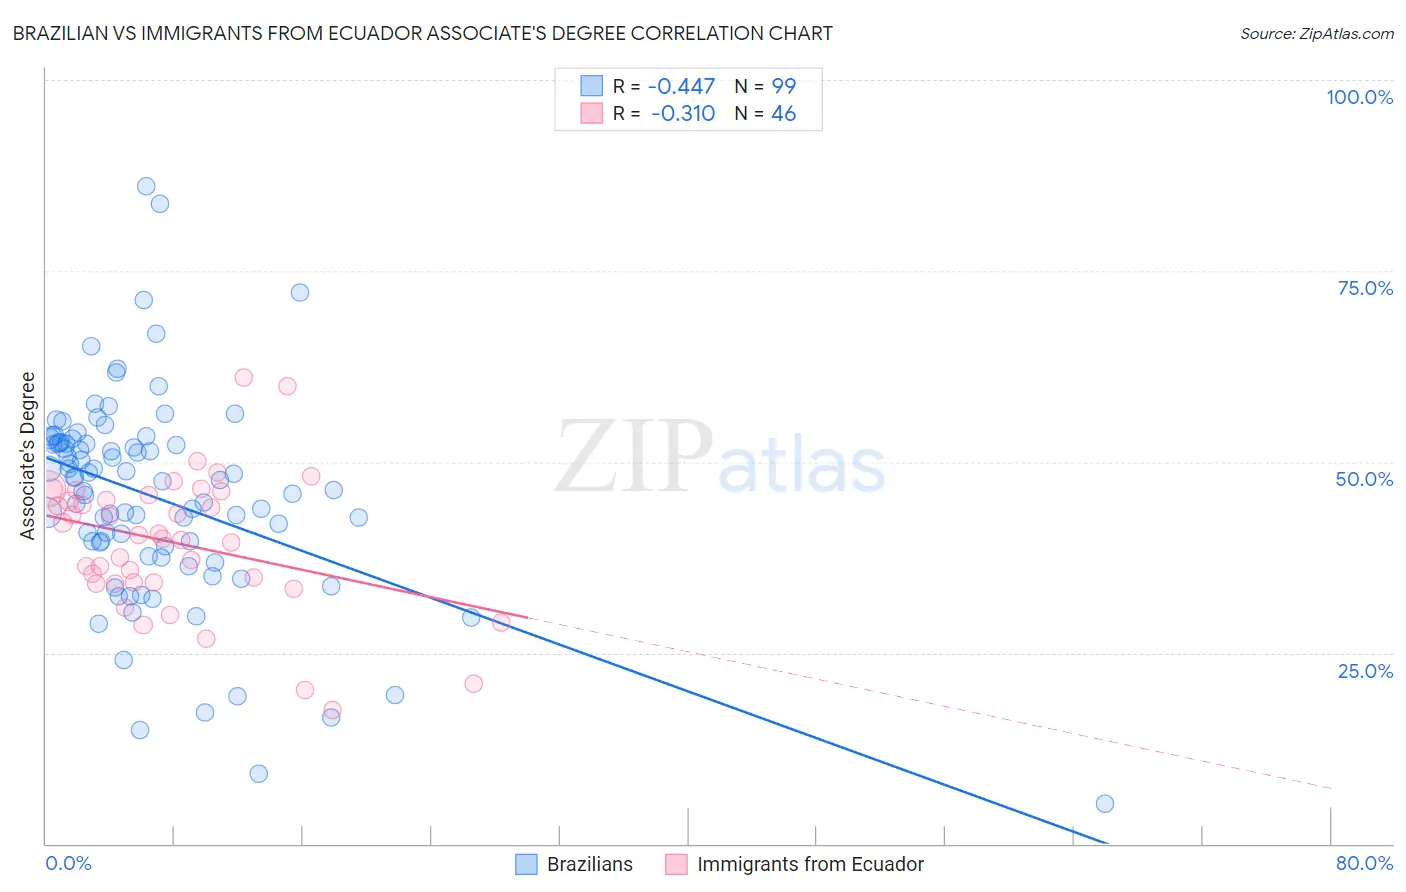
Brazilian vs Immigrants from Ecuador Associate's Degree Correlation Chart
The statistical analysis conducted on geographies consisting of 323,936,214 people shows a moderate negative correlation between the proportion of Brazilians and percentage of population with at least associate's degree education in the United States with a correlation coefficient (R) of -0.447 and weighted average of 48.7%. Similarly, the statistical analysis conducted on geographies consisting of 271,013,289 people shows a mild negative correlation between the proportion of Immigrants from Ecuador and percentage of population with at least associate's degree education in the United States with a correlation coefficient (R) of -0.310 and weighted average of 42.2%, a difference of 15.4%.
Associate's Degree Correlation Summary
| Measurement | Brazilian | Immigrants from Ecuador |
| Minimum | 5.3% | 17.6% |
| Maximum | 86.0% | 61.0% |
| Range | 80.8% | 43.4% |
| Mean | 45.3% | 39.4% |
| Median | 47.5% | 40.1% |
| Interquartile 25% (IQ1) | 38.9% | 34.2% |
| Interquartile 75% (IQ3) | 52.5% | 45.6% |
| Interquartile Range (IQR) | 13.6% | 11.4% |
| Standard Deviation (Sample) | 13.6% | 9.0% |
| Standard Deviation (Population) | 13.6% | 8.9% |
Similar Demographics by Associate's Degree
Demographics Similar to Brazilians by Associate's Degree
In terms of associate's degree, the demographic groups most similar to Brazilians are Italian (48.7%, a difference of 0.060%), Ugandan (48.7%, a difference of 0.070%), Alsatian (48.8%, a difference of 0.29%), Serbian (48.5%, a difference of 0.30%), and Chinese (48.5%, a difference of 0.31%).
| Demographics | Rating | Rank | Associate's Degree |
| British | 95.0 /100 | #116 | Exceptional 48.9% |
| Afghans | 94.8 /100 | #117 | Exceptional 48.9% |
| Albanians | 94.7 /100 | #118 | Exceptional 48.8% |
| Lebanese | 94.6 /100 | #119 | Exceptional 48.8% |
| Alsatians | 94.6 /100 | #120 | Exceptional 48.8% |
| Ugandans | 93.9 /100 | #121 | Exceptional 48.7% |
| Italians | 93.9 /100 | #122 | Exceptional 48.7% |
| Brazilians | 93.7 /100 | #123 | Exceptional 48.7% |
| Serbians | 92.6 /100 | #124 | Exceptional 48.5% |
| Chinese | 92.5 /100 | #125 | Exceptional 48.5% |
| Immigrants | Syria | 92.2 /100 | #126 | Exceptional 48.5% |
| Immigrants | Uganda | 92.1 /100 | #127 | Exceptional 48.5% |
| Immigrants | Eastern Africa | 91.6 /100 | #128 | Exceptional 48.4% |
| Swedes | 91.5 /100 | #129 | Exceptional 48.4% |
| Immigrants | Jordan | 91.2 /100 | #130 | Exceptional 48.4% |
Demographics Similar to Immigrants from Ecuador by Associate's Degree
In terms of associate's degree, the demographic groups most similar to Immigrants from Ecuador are Immigrants from Fiji (42.2%, a difference of 0.090%), Jamaican (42.1%, a difference of 0.14%), U.S. Virgin Islander (42.1%, a difference of 0.16%), Delaware (42.3%, a difference of 0.18%), and Immigrants from Bahamas (42.1%, a difference of 0.18%).
| Demographics | Rating | Rank | Associate's Degree |
| British West Indians | 1.0 /100 | #241 | Tragic 42.4% |
| Immigrants | West Indies | 1.0 /100 | #242 | Tragic 42.4% |
| Guyanese | 1.0 /100 | #243 | Tragic 42.3% |
| Immigrants | Liberia | 0.9 /100 | #244 | Tragic 42.3% |
| Immigrants | Cambodia | 0.9 /100 | #245 | Tragic 42.3% |
| Delaware | 0.9 /100 | #246 | Tragic 42.3% |
| Immigrants | Fiji | 0.8 /100 | #247 | Tragic 42.2% |
| Immigrants | Ecuador | 0.8 /100 | #248 | Tragic 42.2% |
| Jamaicans | 0.7 /100 | #249 | Tragic 42.1% |
| U.S. Virgin Islanders | 0.7 /100 | #250 | Tragic 42.1% |
| Immigrants | Bahamas | 0.7 /100 | #251 | Tragic 42.1% |
| French American Indians | 0.6 /100 | #252 | Tragic 42.0% |
| Indonesians | 0.6 /100 | #253 | Tragic 41.9% |
| Cubans | 0.6 /100 | #254 | Tragic 41.9% |
| Immigrants | Guyana | 0.5 /100 | #255 | Tragic 41.8% |