Brazilian vs Immigrants from Dominican Republic Master's Degree
COMPARE
Brazilian
Immigrants from Dominican Republic
Master's Degree
Master's Degree Comparison
Brazilians
Immigrants from Dominican Republic
16.5%
MASTER'S DEGREE
96.8/ 100
METRIC RATING
118th/ 347
METRIC RANK
12.1%
MASTER'S DEGREE
0.2/ 100
METRIC RATING
280th/ 347
METRIC RANK
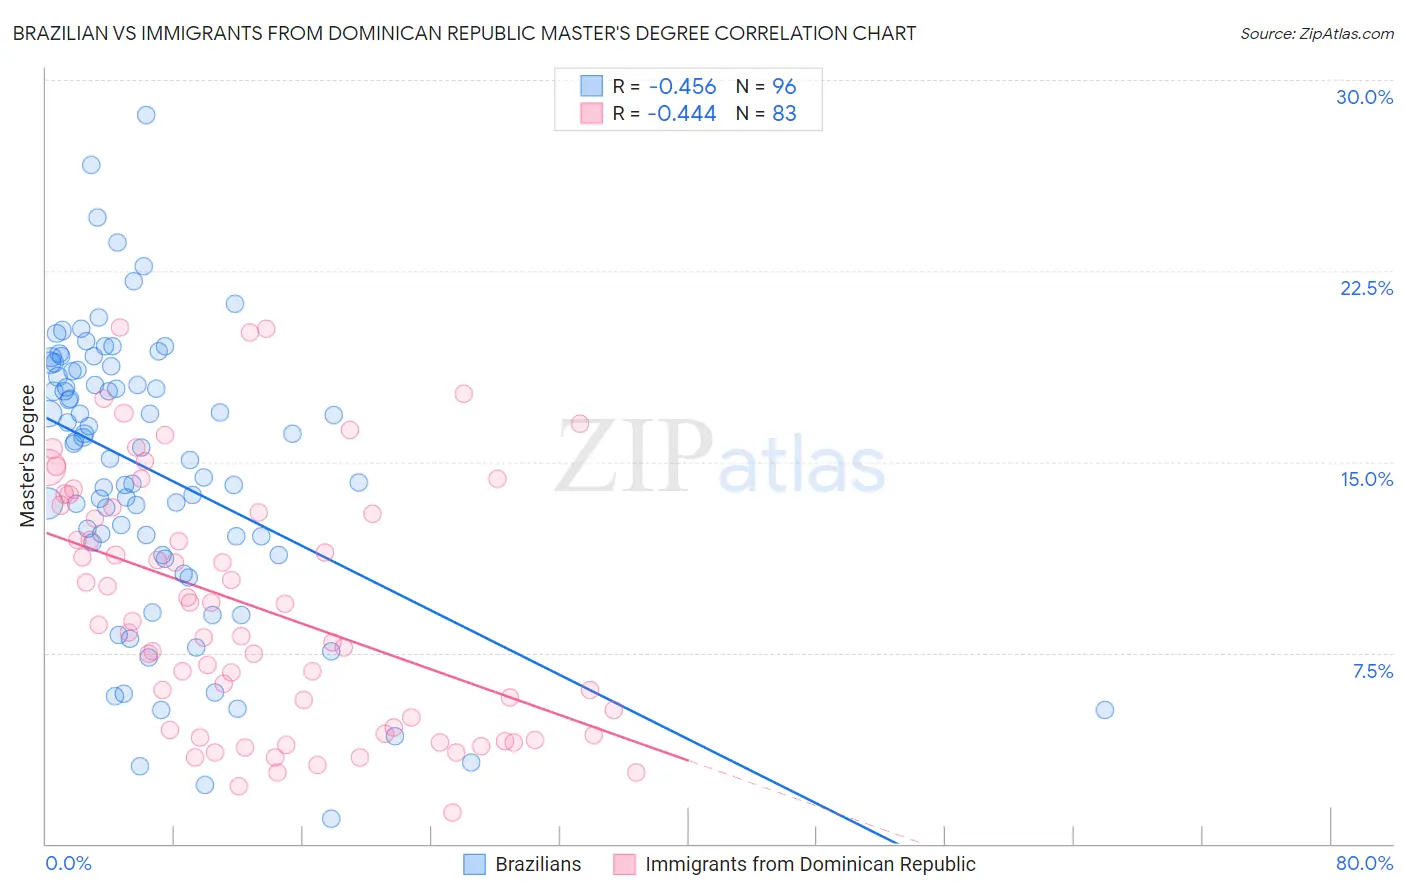
Brazilian vs Immigrants from Dominican Republic Master's Degree Correlation Chart
The statistical analysis conducted on geographies consisting of 323,872,628 people shows a moderate negative correlation between the proportion of Brazilians and percentage of population with at least master's degree education in the United States with a correlation coefficient (R) of -0.456 and weighted average of 16.5%. Similarly, the statistical analysis conducted on geographies consisting of 275,069,954 people shows a moderate negative correlation between the proportion of Immigrants from Dominican Republic and percentage of population with at least master's degree education in the United States with a correlation coefficient (R) of -0.444 and weighted average of 12.1%, a difference of 37.3%.
Master's Degree Correlation Summary
| Measurement | Brazilian | Immigrants from Dominican Republic |
| Minimum | 0.97% | 1.2% |
| Maximum | 28.6% | 20.3% |
| Range | 27.6% | 19.1% |
| Mean | 14.6% | 9.3% |
| Median | 15.7% | 8.6% |
| Interquartile 25% (IQ1) | 11.6% | 4.4% |
| Interquartile 75% (IQ3) | 18.6% | 13.2% |
| Interquartile Range (IQR) | 7.0% | 8.7% |
| Standard Deviation (Sample) | 5.5% | 4.9% |
| Standard Deviation (Population) | 5.5% | 4.9% |
Similar Demographics by Master's Degree
Demographics Similar to Brazilians by Master's Degree
In terms of master's degree, the demographic groups most similar to Brazilians are Jordanian (16.5%, a difference of 0.23%), Lebanese (16.5%, a difference of 0.33%), Immigrants from Moldova (16.6%, a difference of 0.42%), Immigrants from Southern Europe (16.6%, a difference of 0.43%), and Afghan (16.5%, a difference of 0.53%).
| Demographics | Rating | Rank | Master's Degree |
| Austrians | 97.8 /100 | #111 | Exceptional 16.7% |
| Macedonians | 97.7 /100 | #112 | Exceptional 16.7% |
| Arabs | 97.7 /100 | #113 | Exceptional 16.7% |
| Northern Europeans | 97.6 /100 | #114 | Exceptional 16.7% |
| Immigrants | Uganda | 97.3 /100 | #115 | Exceptional 16.6% |
| Immigrants | Southern Europe | 97.2 /100 | #116 | Exceptional 16.6% |
| Immigrants | Moldova | 97.2 /100 | #117 | Exceptional 16.6% |
| Brazilians | 96.8 /100 | #118 | Exceptional 16.5% |
| Jordanians | 96.5 /100 | #119 | Exceptional 16.5% |
| Lebanese | 96.4 /100 | #120 | Exceptional 16.5% |
| Afghans | 96.2 /100 | #121 | Exceptional 16.5% |
| British | 95.6 /100 | #122 | Exceptional 16.4% |
| Croatians | 95.6 /100 | #123 | Exceptional 16.4% |
| Immigrants | Eritrea | 95.5 /100 | #124 | Exceptional 16.4% |
| Italians | 95.4 /100 | #125 | Exceptional 16.4% |
Demographics Similar to Immigrants from Dominican Republic by Master's Degree
In terms of master's degree, the demographic groups most similar to Immigrants from Dominican Republic are Immigrants from Belize (12.1%, a difference of 0.060%), Malaysian (12.0%, a difference of 0.12%), Potawatomi (12.1%, a difference of 0.13%), Immigrants from Caribbean (12.1%, a difference of 0.14%), and Black/African American (12.1%, a difference of 0.15%).
| Demographics | Rating | Rank | Master's Degree |
| Blackfeet | 0.3 /100 | #273 | Tragic 12.1% |
| Cape Verdeans | 0.3 /100 | #274 | Tragic 12.1% |
| Cubans | 0.3 /100 | #275 | Tragic 12.1% |
| Blacks/African Americans | 0.3 /100 | #276 | Tragic 12.1% |
| Immigrants | Caribbean | 0.3 /100 | #277 | Tragic 12.1% |
| Potawatomi | 0.3 /100 | #278 | Tragic 12.1% |
| Immigrants | Belize | 0.2 /100 | #279 | Tragic 12.1% |
| Immigrants | Dominican Republic | 0.2 /100 | #280 | Tragic 12.1% |
| Malaysians | 0.2 /100 | #281 | Tragic 12.0% |
| Immigrants | El Salvador | 0.2 /100 | #282 | Tragic 12.0% |
| Hondurans | 0.2 /100 | #283 | Tragic 11.9% |
| Ottawa | 0.2 /100 | #284 | Tragic 11.9% |
| Immigrants | Nicaragua | 0.2 /100 | #285 | Tragic 11.8% |
| Aleuts | 0.1 /100 | #286 | Tragic 11.8% |
| Immigrants | Haiti | 0.1 /100 | #287 | Tragic 11.8% |