Bolivian vs Immigrants from Central America 11th Grade
COMPARE
Bolivian
Immigrants from Central America
11th Grade
11th Grade Comparison
Bolivians
Immigrants from Central America
92.2%
11TH GRADE
23.2/ 100
METRIC RATING
206th/ 347
METRIC RANK
84.9%
11TH GRADE
0.0/ 100
METRIC RATING
345th/ 347
METRIC RANK
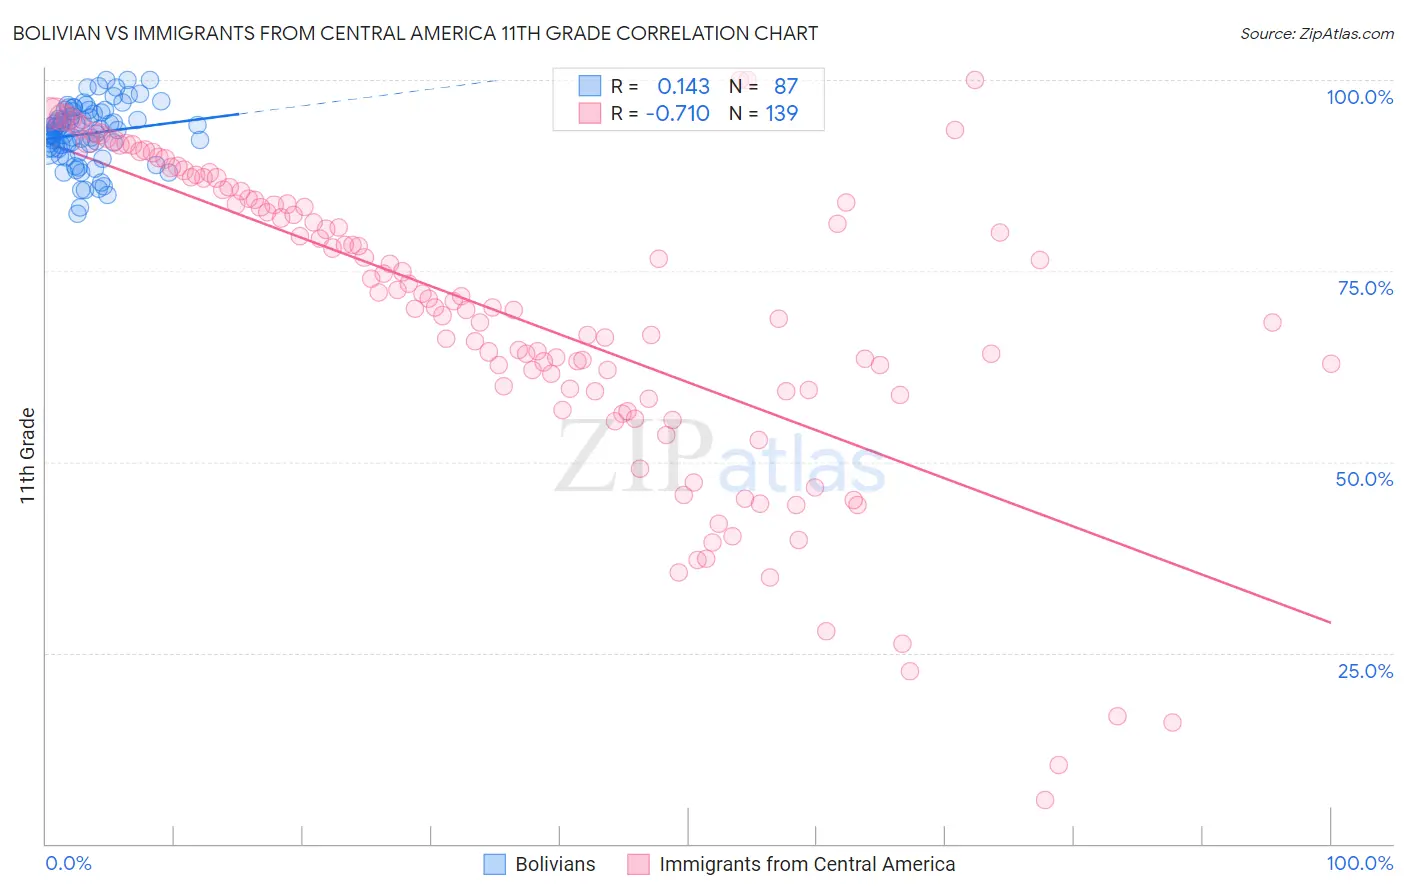
Bolivian vs Immigrants from Central America 11th Grade Correlation Chart
The statistical analysis conducted on geographies consisting of 184,666,822 people shows a poor positive correlation between the proportion of Bolivians and percentage of population with at least 11th grade education in the United States with a correlation coefficient (R) of 0.143 and weighted average of 92.2%. Similarly, the statistical analysis conducted on geographies consisting of 536,553,482 people shows a strong negative correlation between the proportion of Immigrants from Central America and percentage of population with at least 11th grade education in the United States with a correlation coefficient (R) of -0.710 and weighted average of 84.9%, a difference of 8.6%.
11th Grade Correlation Summary
| Measurement | Bolivian | Immigrants from Central America |
| Minimum | 82.4% | 5.7% |
| Maximum | 100.0% | 100.0% |
| Range | 17.6% | 94.3% |
| Mean | 93.0% | 69.1% |
| Median | 93.4% | 71.1% |
| Interquartile 25% (IQ1) | 91.1% | 59.2% |
| Interquartile 75% (IQ3) | 95.8% | 84.5% |
| Interquartile Range (IQR) | 4.7% | 25.2% |
| Standard Deviation (Sample) | 3.9% | 20.1% |
| Standard Deviation (Population) | 3.9% | 20.0% |
Similar Demographics by 11th Grade
Demographics Similar to Bolivians by 11th Grade
In terms of 11th grade, the demographic groups most similar to Bolivians are Immigrants from Sudan (92.3%, a difference of 0.0%), Immigrants from Hong Kong (92.2%, a difference of 0.0%), Kiowa (92.2%, a difference of 0.0%), Immigrants from Eastern Africa (92.3%, a difference of 0.010%), and Immigrants from Oceania (92.2%, a difference of 0.010%).
| Demographics | Rating | Rank | 11th Grade |
| Immigrants | Uganda | 25.2 /100 | #199 | Fair 92.3% |
| Samoans | 25.1 /100 | #200 | Fair 92.3% |
| Immigrants | China | 25.1 /100 | #201 | Fair 92.3% |
| Immigrants | Eastern Africa | 24.1 /100 | #202 | Fair 92.3% |
| Immigrants | Sudan | 23.5 /100 | #203 | Fair 92.3% |
| Immigrants | Hong Kong | 23.3 /100 | #204 | Fair 92.2% |
| Kiowa | 23.2 /100 | #205 | Fair 92.2% |
| Bolivians | 23.2 /100 | #206 | Fair 92.2% |
| Immigrants | Oceania | 22.4 /100 | #207 | Fair 92.2% |
| Colville | 21.8 /100 | #208 | Fair 92.2% |
| Tongans | 19.8 /100 | #209 | Poor 92.2% |
| Ethiopians | 18.8 /100 | #210 | Poor 92.2% |
| Immigrants | Micronesia | 17.7 /100 | #211 | Poor 92.2% |
| Koreans | 14.4 /100 | #212 | Poor 92.1% |
| Immigrants | Ethiopia | 13.9 /100 | #213 | Poor 92.1% |
Demographics Similar to Immigrants from Central America by 11th Grade
In terms of 11th grade, the demographic groups most similar to Immigrants from Central America are Yakama (85.0%, a difference of 0.030%), Spanish American Indian (84.7%, a difference of 0.24%), Immigrants from El Salvador (85.3%, a difference of 0.43%), Immigrants from Mexico (84.5%, a difference of 0.54%), and Immigrants from Guatemala (85.8%, a difference of 1.0%).
| Demographics | Rating | Rank | 11th Grade |
| Immigrants | Yemen | 0.0 /100 | #333 | Tragic 87.1% |
| Houma | 0.0 /100 | #334 | Tragic 87.0% |
| Central Americans | 0.0 /100 | #335 | Tragic 86.9% |
| Immigrants | Dominican Republic | 0.0 /100 | #336 | Tragic 86.9% |
| Immigrants | Honduras | 0.0 /100 | #337 | Tragic 86.9% |
| Immigrants | Latin America | 0.0 /100 | #338 | Tragic 86.8% |
| Guatemalans | 0.0 /100 | #339 | Tragic 86.4% |
| Salvadorans | 0.0 /100 | #340 | Tragic 86.2% |
| Mexicans | 0.0 /100 | #341 | Tragic 86.1% |
| Immigrants | Guatemala | 0.0 /100 | #342 | Tragic 85.8% |
| Immigrants | El Salvador | 0.0 /100 | #343 | Tragic 85.3% |
| Yakama | 0.0 /100 | #344 | Tragic 85.0% |
| Immigrants | Central America | 0.0 /100 | #345 | Tragic 84.9% |
| Spanish American Indians | 0.0 /100 | #346 | Tragic 84.7% |
| Immigrants | Mexico | 0.0 /100 | #347 | Tragic 84.5% |