Black/African American vs Lumbee 12th Grade, No Diploma
COMPARE
Black/African American
Lumbee
12th Grade, No Diploma
12th Grade, No Diploma Comparison
Blacks/African Americans
Lumbee
89.3%
12TH GRADE, NO DIPLOMA
0.1/ 100
METRIC RATING
271st/ 347
METRIC RANK
85.7%
12TH GRADE, NO DIPLOMA
0.0/ 100
METRIC RATING
327th/ 347
METRIC RANK
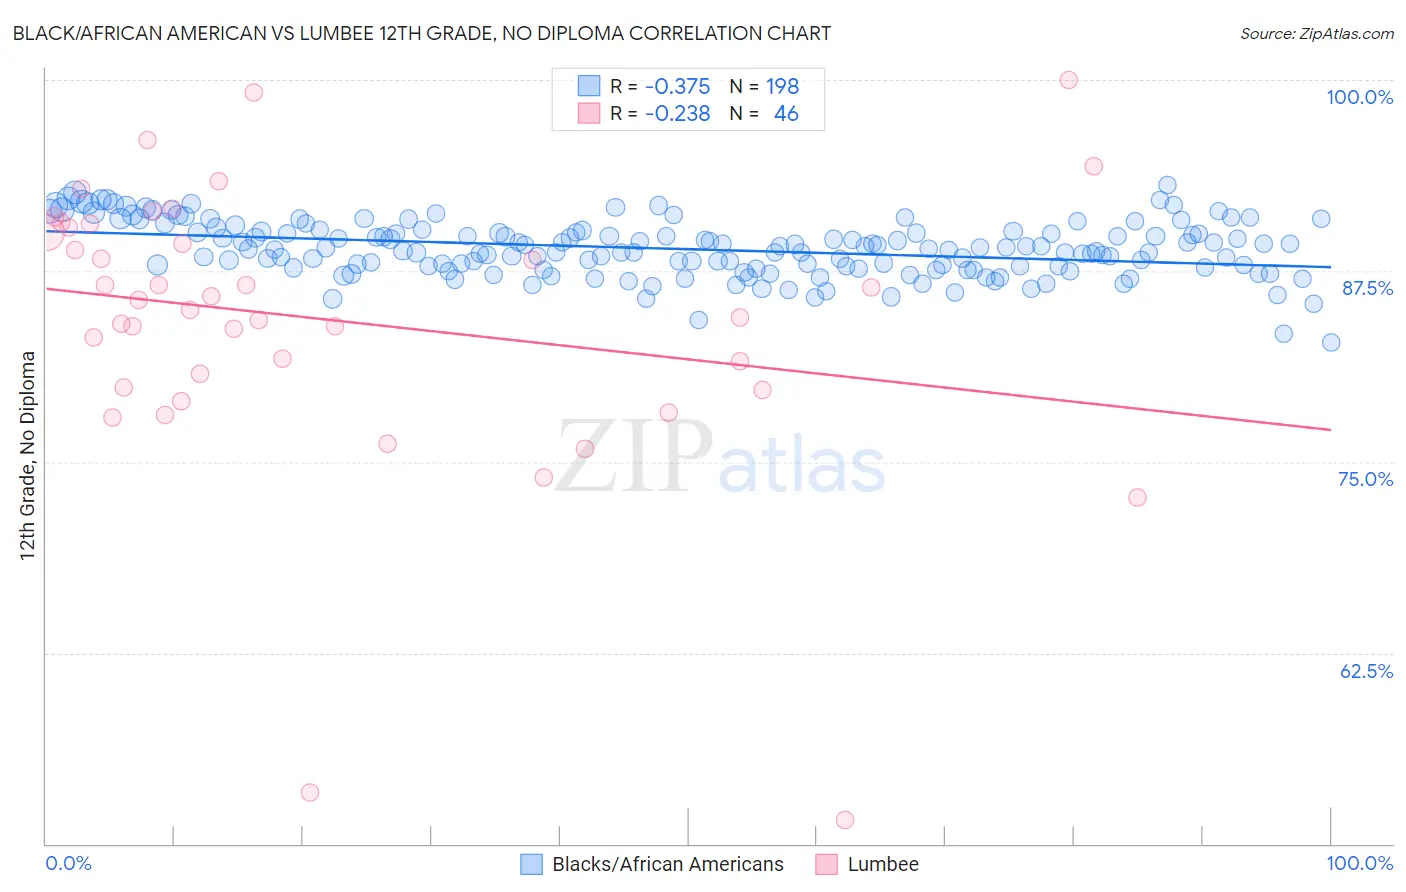
Black/African American vs Lumbee 12th Grade, No Diploma Correlation Chart
The statistical analysis conducted on geographies consisting of 566,032,166 people shows a mild negative correlation between the proportion of Blacks/African Americans and percentage of population with at least 12th grade (no diploma) education in the United States with a correlation coefficient (R) of -0.375 and weighted average of 89.3%. Similarly, the statistical analysis conducted on geographies consisting of 92,299,068 people shows a weak negative correlation between the proportion of Lumbee and percentage of population with at least 12th grade (no diploma) education in the United States with a correlation coefficient (R) of -0.238 and weighted average of 85.7%, a difference of 4.2%.
12th Grade, No Diploma Correlation Summary
| Measurement | Black/African American | Lumbee |
| Minimum | 82.8% | 51.6% |
| Maximum | 93.1% | 100.0% |
| Range | 10.3% | 48.4% |
| Mean | 88.9% | 84.3% |
| Median | 88.9% | 85.3% |
| Interquartile 25% (IQ1) | 87.7% | 79.8% |
| Interquartile 75% (IQ3) | 90.0% | 90.3% |
| Interquartile Range (IQR) | 2.3% | 10.5% |
| Standard Deviation (Sample) | 1.8% | 9.3% |
| Standard Deviation (Population) | 1.8% | 9.2% |
Similar Demographics by 12th Grade, No Diploma
Demographics Similar to Blacks/African Americans by 12th Grade, No Diploma
In terms of 12th grade, no diploma, the demographic groups most similar to Blacks/African Americans are Bangladeshi (89.3%, a difference of 0.0%), Malaysian (89.2%, a difference of 0.010%), U.S. Virgin Islander (89.3%, a difference of 0.050%), Immigrants from Trinidad and Tobago (89.3%, a difference of 0.080%), and West Indian (89.3%, a difference of 0.10%).
| Demographics | Rating | Rank | 12th Grade, No Diploma |
| Sri Lankans | 0.2 /100 | #264 | Tragic 89.4% |
| Trinidadians and Tobagonians | 0.2 /100 | #265 | Tragic 89.4% |
| Seminole | 0.2 /100 | #266 | Tragic 89.4% |
| West Indians | 0.2 /100 | #267 | Tragic 89.3% |
| Immigrants | Trinidad and Tobago | 0.1 /100 | #268 | Tragic 89.3% |
| U.S. Virgin Islanders | 0.1 /100 | #269 | Tragic 89.3% |
| Bangladeshis | 0.1 /100 | #270 | Tragic 89.3% |
| Blacks/African Americans | 0.1 /100 | #271 | Tragic 89.3% |
| Malaysians | 0.1 /100 | #272 | Tragic 89.2% |
| Barbadians | 0.1 /100 | #273 | Tragic 89.1% |
| Cajuns | 0.1 /100 | #274 | Tragic 89.1% |
| Immigrants | Congo | 0.1 /100 | #275 | Tragic 89.0% |
| Ute | 0.1 /100 | #276 | Tragic 89.0% |
| Immigrants | Barbados | 0.0 /100 | #277 | Tragic 89.0% |
| Immigrants | St. Vincent and the Grenadines | 0.0 /100 | #278 | Tragic 88.9% |
Demographics Similar to Lumbee by 12th Grade, No Diploma
In terms of 12th grade, no diploma, the demographic groups most similar to Lumbee are Dominican (85.7%, a difference of 0.010%), Mexican American Indian (85.7%, a difference of 0.030%), Immigrants from Cabo Verde (85.8%, a difference of 0.10%), Honduran (85.5%, a difference of 0.19%), and Hispanic or Latino (85.4%, a difference of 0.28%).
| Demographics | Rating | Rank | 12th Grade, No Diploma |
| Immigrants | Nicaragua | 0.0 /100 | #320 | Tragic 86.6% |
| Puerto Ricans | 0.0 /100 | #321 | Tragic 86.5% |
| Central American Indians | 0.0 /100 | #322 | Tragic 86.5% |
| Yuman | 0.0 /100 | #323 | Tragic 86.5% |
| Immigrants | Cabo Verde | 0.0 /100 | #324 | Tragic 85.8% |
| Mexican American Indians | 0.0 /100 | #325 | Tragic 85.7% |
| Dominicans | 0.0 /100 | #326 | Tragic 85.7% |
| Lumbee | 0.0 /100 | #327 | Tragic 85.7% |
| Hondurans | 0.0 /100 | #328 | Tragic 85.5% |
| Hispanics or Latinos | 0.0 /100 | #329 | Tragic 85.4% |
| Immigrants | Azores | 0.0 /100 | #330 | Tragic 85.3% |
| Central Americans | 0.0 /100 | #331 | Tragic 85.2% |
| Immigrants | Honduras | 0.0 /100 | #332 | Tragic 85.0% |
| Immigrants | Latin America | 0.0 /100 | #333 | Tragic 85.0% |
| Immigrants | Dominican Republic | 0.0 /100 | #334 | Tragic 84.9% |