Black/African American vs Immigrants from Zaire High School Diploma

COMPARE

Black/African American
Race
Ancestry
AfghanAfricanAlaska NativeAlaskan AthabascanAlbanianAleutAlsatianAmericanApacheArabArapahoArgentineanArmenianAssyrian/Chaldean/SyriacAustralianAustrianBahamianBangladeshiBarbadianBasqueBelgianBelizeanBermudanBhutaneseBlackfeetBolivianBrazilianBritishBritish West IndianBulgarianBurmeseCajunCambodianCanadianCape VerdeanCarpatho RusynCelticCentral AmericanCentral American IndianCherokeeCheyenneChickasawChileanChineseChippewaChoctawColombianColvilleComancheCosta RicanCreeCreekCroatianCrowCubanCypriotCzechCzechoslovakianDanishDelawareDominicanDutchDutch West IndianEastern EuropeanEcuadorianEgyptianEnglishEstonianEthiopianEuropeanFijianFilipinoFinnishFrenchFrench American IndianFrench CanadianGermanGerman RussianGhanaianGreekGuamanian/ChamorroGuatemalanGuyaneseHaitianHmongHonduranHopiHoumaHungarianIcelanderIndian (Asian)IndonesianInupiatIranianIraqiIrishIroquoisIsraeliItalianJamaicanJapaneseJordanianKenyanKiowaKoreanLaotianLatvianLebaneseLiberianLithuanianLumbeeLuxembourgerMacedonianMalaysianMalteseMarshalleseMenomineeMexicanMexican American IndianMongolianMoroccanNative HawaiianNavajoNepaleseNew ZealanderNicaraguanNigerianNorthern EuropeanNorwegianOkinawanOsageOttawaPaiutePakistaniPalestinianPanamanianParaguayanPennsylvania GermanPeruvianPimaPolishPortuguesePotawatomiPuebloPuerto RicanPuget Sound SalishRomanianRussianSalvadoranSamoanScandinavianScotch-IrishScottishSeminoleSenegaleseSerbianShoshoneSierra LeoneanSiouxSlavicSlovakSloveneSomaliSouth AfricanSouth AmericanSouth American IndianSoviet UnionSpaniardSpanishSpanish AmericanSpanish American IndianSri LankanSubsaharan AfricanSudaneseSwedishSwissSyrianTaiwaneseThaiTlingit-HaidaTohono O'OdhamTonganTrinidadian and TobagonianTsimshianTurkishU.S. Virgin IslanderUgandanUkrainianUruguayanUteVenezuelanVietnameseWelshWest IndianYakamaYaquiYugoslavianYumanYup'ikZimbabwean
Immigration
NonimmigrantsImmigrantsAfghanistanAfricaAlbaniaArgentinaArmeniaAsiaAustraliaAustriaBahamasBangladeshBarbadosBelarusBelgiumBelizeBoliviaBosnia and HerzegovinaBrazilBulgariaBurma/MyanmarCabo VerdeCambodiaCameroonCanadaCaribbeanCentral AmericaChileChinaColombiaCongoCosta RicaCroatiaCubaCzechoslovakiaDenmarkDominicaDominican RepublicEastern AfricaEastern AsiaEastern EuropeEcuadorEgyptEl SalvadorEnglandEritreaEthiopiaEuropeFijiFranceGermanyGhanaGreeceGrenadaGuatemalaGuyanaHaitiHondurasHong KongHungaryIndiaIndonesiaIranIraqIrelandIsraelItalyJamaicaJapanJordanKazakhstanKenyaKoreaKuwaitLaosLatin AmericaLatviaLebanonLiberiaLithuaniaMalaysiaMexicoMicronesiaMiddle AfricaMoldovaMoroccoNepalNetherlandsNicaraguaNigeriaNorth AmericaNorth MacedoniaNorthern AfricaNorthern EuropeNorwayOceaniaPakistanPanamaPeruPhilippinesPolandPortugalRomaniaRussiaSaudi ArabiaScotlandSenegalSerbiaSierra LeoneSingaporeSomaliaSouth AfricaSouth AmericaSouth Central AsiaSouth Eastern AsiaSouthern EuropeSpainSri LankaSt. Vincent and the GrenadinesSudanSwedenSwitzerlandSyriaTaiwanThailandTrinidad and TobagoTurkeyUgandaUkraineUruguayUzbekistanVenezuelaVietnamWest IndiesWestern AfricaWestern AsiaWestern EuropeYemenZimbabweAzores
Immigrants from Zaire
Race
Ancestry
AfghanAfricanAlaska NativeAlaskan AthabascanAlbanianAleutAlsatianAmericanApacheArabArapahoArgentineanArmenianAssyrian/Chaldean/SyriacAustralianAustrianBahamianBangladeshiBarbadianBasqueBelgianBelizeanBermudanBhutaneseBlackfeetBolivianBrazilianBritishBritish West IndianBulgarianBurmeseCajunCambodianCanadianCape VerdeanCarpatho RusynCelticCentral AmericanCentral American IndianCherokeeCheyenneChickasawChileanChineseChippewaChoctawColombianColvilleComancheCosta RicanCreeCreekCroatianCrowCubanCypriotCzechCzechoslovakianDanishDelawareDominicanDutchDutch West IndianEastern EuropeanEcuadorianEgyptianEnglishEstonianEthiopianEuropeanFijianFilipinoFinnishFrenchFrench American IndianFrench CanadianGermanGerman RussianGhanaianGreekGuamanian/ChamorroGuatemalanGuyaneseHaitianHmongHonduranHopiHoumaHungarianIcelanderIndian (Asian)IndonesianInupiatIranianIraqiIrishIroquoisIsraeliItalianJamaicanJapaneseJordanianKenyanKiowaKoreanLaotianLatvianLebaneseLiberianLithuanianLumbeeLuxembourgerMacedonianMalaysianMalteseMarshalleseMenomineeMexicanMexican American IndianMongolianMoroccanNative HawaiianNavajoNepaleseNew ZealanderNicaraguanNigerianNorthern EuropeanNorwegianOkinawanOsageOttawaPaiutePakistaniPalestinianPanamanianParaguayanPennsylvania GermanPeruvianPimaPolishPortuguesePotawatomiPuebloPuerto RicanPuget Sound SalishRomanianRussianSalvadoranSamoanScandinavianScotch-IrishScottishSeminoleSenegaleseSerbianShoshoneSierra LeoneanSiouxSlavicSlovakSloveneSomaliSouth AfricanSouth AmericanSouth American IndianSoviet UnionSpaniardSpanishSpanish AmericanSpanish American IndianSri LankanSubsaharan AfricanSudaneseSwedishSwissSyrianTaiwaneseThaiTlingit-HaidaTohono O'OdhamTonganTrinidadian and TobagonianTsimshianTurkishU.S. Virgin IslanderUgandanUkrainianUruguayanUteVenezuelanVietnameseWelshWest IndianYakamaYaquiYugoslavianYumanYup'ikZimbabwean
Immigration
NonimmigrantsImmigrantsAfghanistanAfricaAlbaniaArgentinaArmeniaAsiaAustraliaAustriaBahamasBangladeshBarbadosBelarusBelgiumBelizeBoliviaBosnia and HerzegovinaBrazilBulgariaBurma/MyanmarCabo VerdeCambodiaCameroonCanadaCaribbeanCentral AmericaChileChinaColombiaCongoCosta RicaCroatiaCubaCzechoslovakiaDenmarkDominicaDominican RepublicEastern AfricaEastern AsiaEastern EuropeEcuadorEgyptEl SalvadorEnglandEritreaEthiopiaEuropeFijiFranceGermanyGhanaGreeceGrenadaGuatemalaGuyanaHaitiHondurasHong KongHungaryIndiaIndonesiaIranIraqIrelandIsraelItalyJamaicaJapanJordanKazakhstanKenyaKoreaKuwaitLaosLatin AmericaLatviaLebanonLiberiaLithuaniaMalaysiaMexicoMicronesiaMiddle AfricaMoldovaMoroccoNepalNetherlandsNicaraguaNigeriaNorth AmericaNorth MacedoniaNorthern AfricaNorthern EuropeNorwayOceaniaPakistanPanamaPeruPhilippinesPolandPortugalRomaniaRussiaSaudi ArabiaScotlandSenegalSerbiaSierra LeoneSingaporeSomaliaSouth AfricaSouth AmericaSouth Central AsiaSouth Eastern AsiaSouthern EuropeSpainSri LankaSt. Vincent and the GrenadinesSudanSwedenSwitzerlandSyriaTaiwanThailandTrinidad and TobagoTurkeyUgandaUkraineUruguayUzbekistanVenezuelaVietnamWest IndiesWestern AfricaWestern AsiaWestern EuropeYemenZaireZimbabweAzores
High School Diploma
Income
Poverty
Unemployment
Labor Participation
Family Structure
Vehicle Availability
Education Level
Disability

High School Diploma Comparison

Blacks/African Americans

Immigrants from Zaire

Tragic
Tragic
87.0%
HIGH SCHOOL DIPLOMA
0.2/ 100
METRIC RATING
267th/ 347
METRIC RANK
88.3%
HIGH SCHOOL DIPLOMA
7.6/ 100
METRIC RATING
223rd/ 347
METRIC RANK

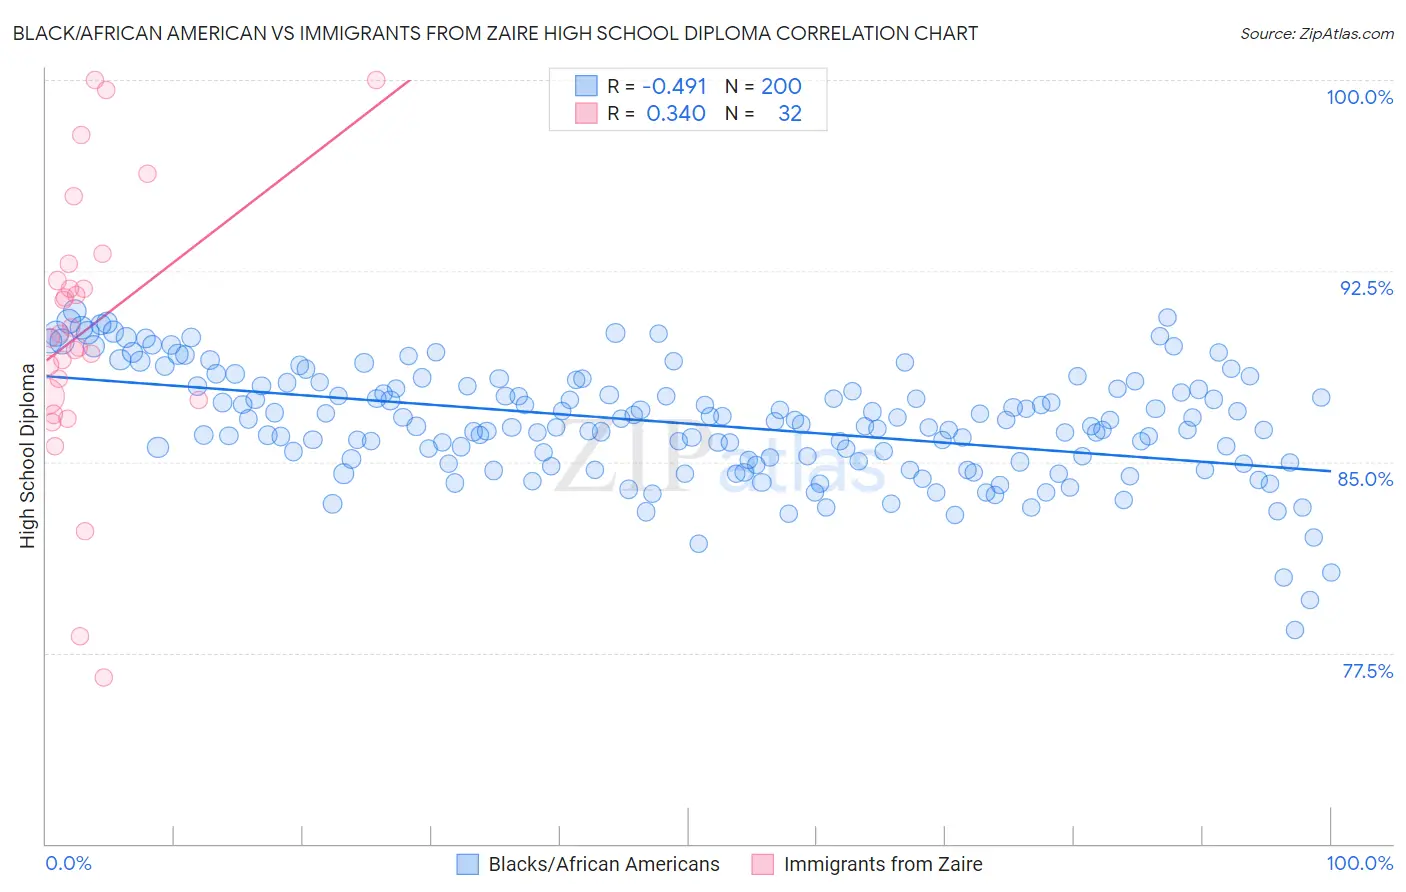
Black/African American vs Immigrants from Zaire High School Diploma Correlation Chart

The statistical analysis conducted on geographies consisting of 566,048,038 people shows a moderate negative correlation between the proportion of Blacks/African Americans and percentage of population with at least high school diploma education in the United States with a correlation coefficient (R) of -0.491 and weighted average of 87.0%. Similarly, the statistical analysis conducted on geographies consisting of 107,255,805 people shows a mild positive correlation between the proportion of Immigrants from Zaire and percentage of population with at least high school diploma education in the United States with a correlation coefficient (R) of 0.340 and weighted average of 88.3%, a difference of 1.5%.
Black/African American vs Immigrants from Zaire High School Diploma

High School Diploma Correlation Summary

MeasurementBlack/African AmericanImmigrants from Zaire
Minimum78.4%76.5%
Maximum90.9%100.0%
Range12.5%23.5%
Mean86.5%90.2%
Median86.4%90.0%
Interquartile 25% (IQ1)85.0%87.5%
Interquartile 75% (IQ3)88.0%92.5%
Interquartile Range (IQR)3.0%5.0%
Standard Deviation (Sample)2.2%5.4%
Standard Deviation (Population)2.2%5.3%

Similar Demographics by High School Diploma

Demographics Similar to Blacks/African Americans by High School Diploma

In terms of high school diploma, the demographic groups most similar to Blacks/African Americans are Immigrants from Congo (87.0%, a difference of 0.010%), Pennsylvania German (87.0%, a difference of 0.030%), Sri Lankan (87.0%, a difference of 0.040%), U.S. Virgin Islander (87.1%, a difference of 0.060%), and Malaysian (87.0%, a difference of 0.060%).
DemographicsRating | RankHigh School Diploma
Cajuns
0.4
/100
|
#260
Tragic
87.3%
Seminole
0.4
/100
|
#261
Tragic
87.3%
Immigrants | Peru
0.4
/100
|
#262
Tragic
87.3%
Immigrants | South Eastern Asia
0.3
/100
|
#263
Tragic
87.2%
Jamaicans
0.3
/100
|
#264
Tragic
87.2%
U.S. Virgin Islanders
0.2
/100
|
#265
Tragic
87.1%
Immigrants | Congo
0.2
/100
|
#266
Tragic
87.0%
Blacks/African Americans
0.2
/100
|
#267
Tragic
87.0%
Pennsylvania Germans
0.2
/100
|
#268
Tragic
87.0%
Sri Lankans
0.2
/100
|
#269
Tragic
87.0%
Malaysians
0.2
/100
|
#270
Tragic
87.0%
West Indians
0.1
/100
|
#271
Tragic
86.9%
Trinidadians and Tobagonians
0.1
/100
|
#272
Tragic
86.9%
Immigrants | Jamaica
0.1
/100
|
#273
Tragic
86.9%
Bangladeshis
0.1
/100
|
#274
Tragic
86.9%

Demographics Similar to Immigrants from Zaire by High School Diploma

In terms of high school diploma, the demographic groups most similar to Immigrants from Zaire are Colville (88.3%, a difference of 0.010%), Shoshone (88.3%, a difference of 0.040%), Creek (88.3%, a difference of 0.040%), Immigrants from Afghanistan (88.3%, a difference of 0.050%), and Tongan (88.4%, a difference of 0.090%).
DemographicsRating | RankHigh School Diploma
Chickasaw
10.7
/100
|
#216
Poor
88.4%
Immigrants | Africa
10.6
/100
|
#217
Poor
88.4%
Immigrants | Bolivia
10.3
/100
|
#218
Poor
88.4%
Costa Ricans
9.6
/100
|
#219
Tragic
88.4%
Tongans
9.5
/100
|
#220
Tragic
88.4%
Immigrants | Afghanistan
8.6
/100
|
#221
Tragic
88.3%
Colville
7.8
/100
|
#222
Tragic
88.3%
Immigrants | Zaire
7.6
/100
|
#223
Tragic
88.3%
Shoshone
7.0
/100
|
#224
Tragic
88.3%
Creek
6.9
/100
|
#225
Tragic
88.3%
Uruguayans
5.6
/100
|
#226
Tragic
88.2%
Immigrants | Liberia
5.5
/100
|
#227
Tragic
88.2%
Kiowa
5.3
/100
|
#228
Tragic
88.2%
Nigerians
5.2
/100
|
#229
Tragic
88.2%
Blackfeet
4.2
/100
|
#230
Tragic
88.1%