Black/African American vs Immigrants from China 4th Grade
COMPARE
Black/African American
Immigrants from China
4th Grade
4th Grade Comparison
Blacks/African Americans
Immigrants from China
97.4%
4TH GRADE
31.1/ 100
METRIC RATING
190th/ 347
METRIC RANK
97.0%
4TH GRADE
0.3/ 100
METRIC RATING
266th/ 347
METRIC RANK
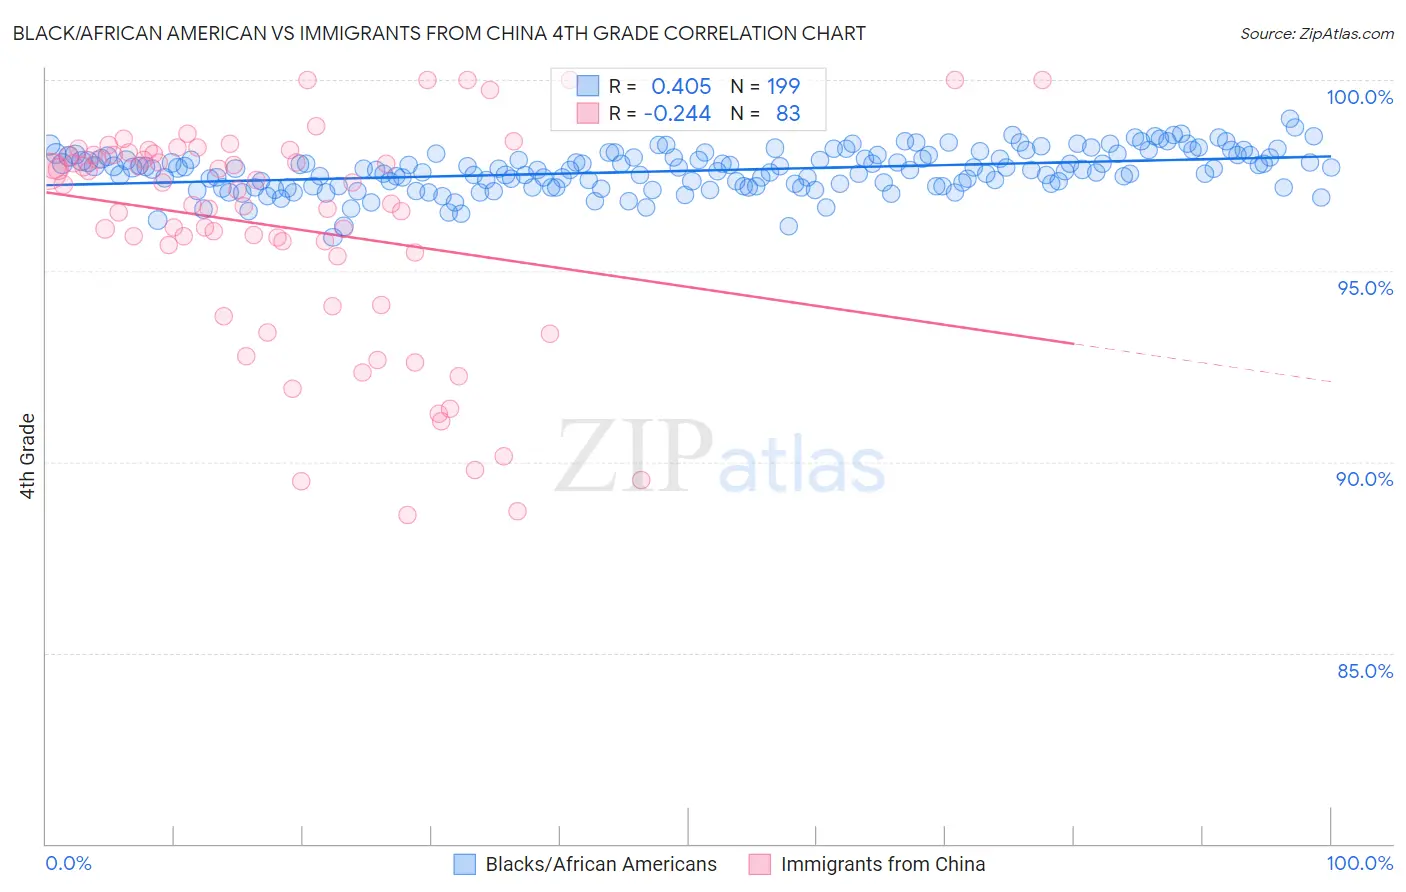
Black/African American vs Immigrants from China 4th Grade Correlation Chart
The statistical analysis conducted on geographies consisting of 566,043,750 people shows a moderate positive correlation between the proportion of Blacks/African Americans and percentage of population with at least 4th grade education in the United States with a correlation coefficient (R) of 0.405 and weighted average of 97.4%. Similarly, the statistical analysis conducted on geographies consisting of 457,082,957 people shows a weak negative correlation between the proportion of Immigrants from China and percentage of population with at least 4th grade education in the United States with a correlation coefficient (R) of -0.244 and weighted average of 97.0%, a difference of 0.49%.
4th Grade Correlation Summary
| Measurement | Black/African American | Immigrants from China |
| Minimum | 95.9% | 88.6% |
| Maximum | 99.0% | 100.0% |
| Range | 3.1% | 11.4% |
| Mean | 97.6% | 96.1% |
| Median | 97.7% | 97.1% |
| Interquartile 25% (IQ1) | 97.2% | 95.4% |
| Interquartile 75% (IQ3) | 98.0% | 98.0% |
| Interquartile Range (IQR) | 0.79% | 2.7% |
| Standard Deviation (Sample) | 0.53% | 2.9% |
| Standard Deviation (Population) | 0.53% | 2.9% |
Similar Demographics by 4th Grade
Demographics Similar to Blacks/African Americans by 4th Grade
In terms of 4th grade, the demographic groups most similar to Blacks/African Americans are Panamanian (97.4%, a difference of 0.0%), Navajo (97.4%, a difference of 0.0%), Immigrants from Ukraine (97.4%, a difference of 0.0%), Immigrants from Egypt (97.4%, a difference of 0.0%), and Portuguese (97.4%, a difference of 0.010%).
| Demographics | Rating | Rank | 4th Grade |
| Argentineans | 39.0 /100 | #183 | Fair 97.5% |
| Pakistanis | 36.2 /100 | #184 | Fair 97.5% |
| Immigrants | Kenya | 35.8 /100 | #185 | Fair 97.5% |
| Dutch West Indians | 35.8 /100 | #186 | Fair 97.5% |
| Mongolians | 34.7 /100 | #187 | Fair 97.5% |
| Immigrants | Argentina | 34.6 /100 | #188 | Fair 97.5% |
| Panamanians | 31.9 /100 | #189 | Fair 97.4% |
| Blacks/African Americans | 31.1 /100 | #190 | Fair 97.4% |
| Navajo | 30.7 /100 | #191 | Fair 97.4% |
| Immigrants | Ukraine | 30.1 /100 | #192 | Fair 97.4% |
| Immigrants | Egypt | 30.1 /100 | #193 | Fair 97.4% |
| Portuguese | 29.2 /100 | #194 | Fair 97.4% |
| Paraguayans | 28.9 /100 | #195 | Fair 97.4% |
| Immigrants | Albania | 27.7 /100 | #196 | Fair 97.4% |
| Hawaiians | 25.6 /100 | #197 | Fair 97.4% |
Demographics Similar to Immigrants from China by 4th Grade
In terms of 4th grade, the demographic groups most similar to Immigrants from China are Immigrants from Nigeria (97.0%, a difference of 0.0%), Taiwanese (97.0%, a difference of 0.010%), Armenian (97.0%, a difference of 0.010%), Ghanaian (97.0%, a difference of 0.010%), and Immigrants from Jamaica (97.0%, a difference of 0.020%).
| Demographics | Rating | Rank | 4th Grade |
| Immigrants | Ethiopia | 0.4 /100 | #259 | Tragic 97.0% |
| Immigrants | Sierra Leone | 0.4 /100 | #260 | Tragic 97.0% |
| Immigrants | South America | 0.4 /100 | #261 | Tragic 97.0% |
| West Indians | 0.4 /100 | #262 | Tragic 97.0% |
| Immigrants | Jamaica | 0.3 /100 | #263 | Tragic 97.0% |
| Taiwanese | 0.3 /100 | #264 | Tragic 97.0% |
| Armenians | 0.3 /100 | #265 | Tragic 97.0% |
| Immigrants | China | 0.3 /100 | #266 | Tragic 97.0% |
| Immigrants | Nigeria | 0.3 /100 | #267 | Tragic 97.0% |
| Ghanaians | 0.2 /100 | #268 | Tragic 97.0% |
| Immigrants | Uzbekistan | 0.2 /100 | #269 | Tragic 96.9% |
| Cubans | 0.2 /100 | #270 | Tragic 96.9% |
| Immigrants | Peru | 0.1 /100 | #271 | Tragic 96.9% |
| Fijians | 0.1 /100 | #272 | Tragic 96.9% |
| Immigrants | Cameroon | 0.1 /100 | #273 | Tragic 96.9% |