Black/African American vs Alaska Native Bachelor's Degree
COMPARE
Black/African American
Alaska Native
Bachelor's Degree
Bachelor's Degree Comparison
Blacks/African Americans
Alaska Natives
30.9%
BACHELOR'S DEGREE
0.1/ 100
METRIC RATING
291st/ 347
METRIC RANK
29.4%
BACHELOR'S DEGREE
0.0/ 100
METRIC RATING
313th/ 347
METRIC RANK
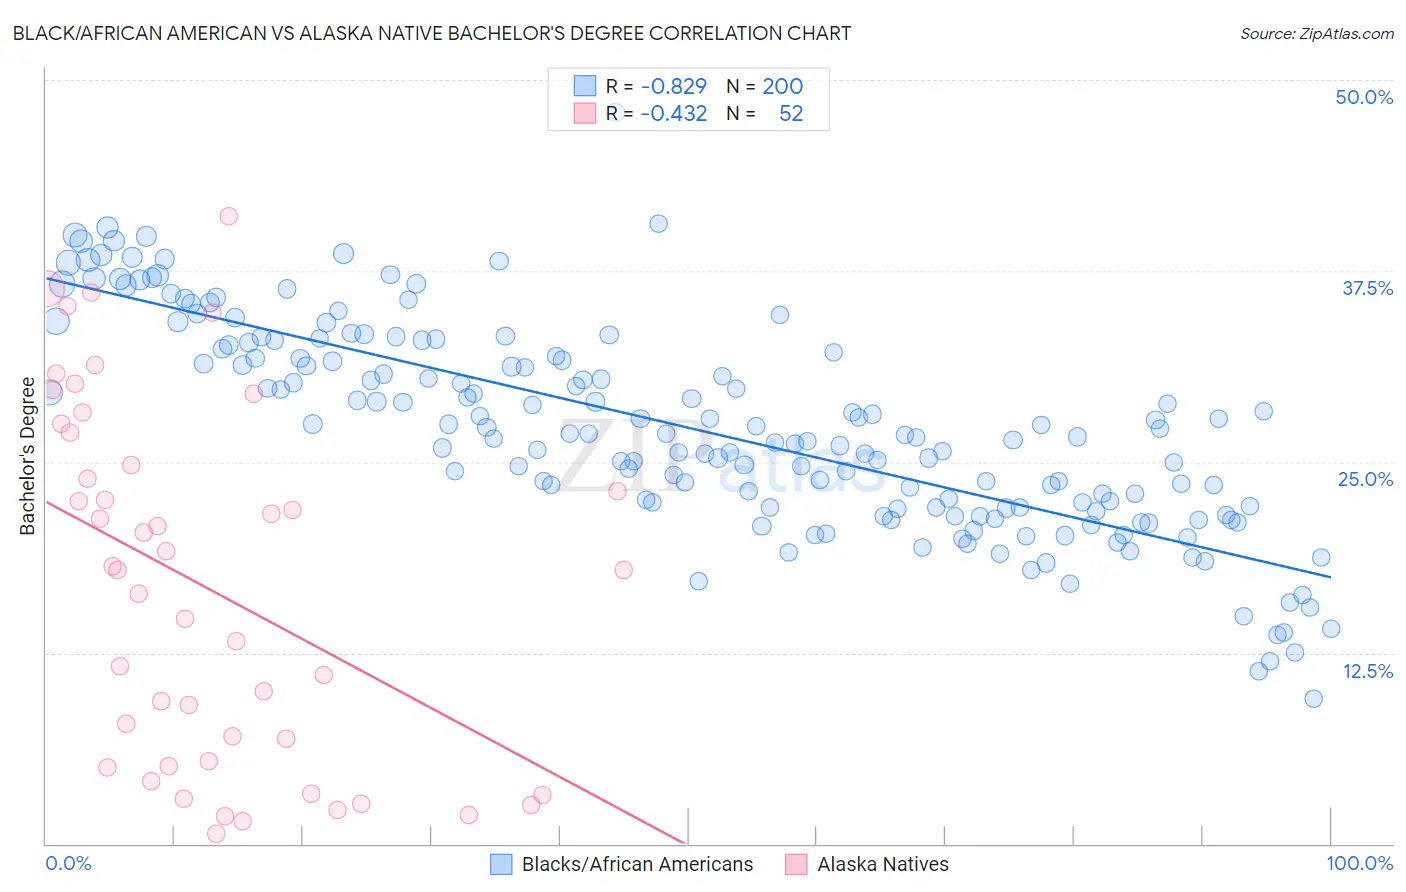
Black/African American vs Alaska Native Bachelor's Degree Correlation Chart
The statistical analysis conducted on geographies consisting of 565,857,967 people shows a very strong negative correlation between the proportion of Blacks/African Americans and percentage of population with at least bachelor's degree education in the United States with a correlation coefficient (R) of -0.829 and weighted average of 30.9%. Similarly, the statistical analysis conducted on geographies consisting of 76,776,170 people shows a moderate negative correlation between the proportion of Alaska Natives and percentage of population with at least bachelor's degree education in the United States with a correlation coefficient (R) of -0.432 and weighted average of 29.4%, a difference of 5.4%.
Bachelor's Degree Correlation Summary
| Measurement | Black/African American | Alaska Native |
| Minimum | 9.5% | 0.66% |
| Maximum | 47.9% | 41.1% |
| Range | 38.4% | 40.4% |
| Mean | 27.2% | 16.8% |
| Median | 26.9% | 17.9% |
| Interquartile 25% (IQ1) | 22.0% | 5.2% |
| Interquartile 75% (IQ3) | 32.3% | 25.9% |
| Interquartile Range (IQR) | 10.3% | 20.6% |
| Standard Deviation (Sample) | 6.8% | 11.5% |
| Standard Deviation (Population) | 6.8% | 11.4% |
Similar Demographics by Bachelor's Degree
Demographics Similar to Blacks/African Americans by Bachelor's Degree
In terms of bachelor's degree, the demographic groups most similar to Blacks/African Americans are Immigrants from Honduras (30.9%, a difference of 0.040%), Puerto Rican (31.0%, a difference of 0.080%), Ute (30.9%, a difference of 0.080%), Cape Verdean (30.9%, a difference of 0.18%), and Guatemalan (31.0%, a difference of 0.22%).
| Demographics | Rating | Rank | Bachelor's Degree |
| Haitians | 0.1 /100 | #284 | Tragic 31.3% |
| Aleuts | 0.1 /100 | #285 | Tragic 31.3% |
| Immigrants | El Salvador | 0.1 /100 | #286 | Tragic 31.3% |
| Ottawa | 0.1 /100 | #287 | Tragic 31.1% |
| Guatemalans | 0.1 /100 | #288 | Tragic 31.0% |
| Puerto Ricans | 0.1 /100 | #289 | Tragic 31.0% |
| Immigrants | Honduras | 0.1 /100 | #290 | Tragic 30.9% |
| Blacks/African Americans | 0.1 /100 | #291 | Tragic 30.9% |
| Ute | 0.1 /100 | #292 | Tragic 30.9% |
| Cape Verdeans | 0.1 /100 | #293 | Tragic 30.9% |
| Immigrants | Guatemala | 0.0 /100 | #294 | Tragic 30.8% |
| Immigrants | Dominican Republic | 0.0 /100 | #295 | Tragic 30.7% |
| Puget Sound Salish | 0.0 /100 | #296 | Tragic 30.7% |
| Immigrants | Haiti | 0.0 /100 | #297 | Tragic 30.6% |
| Chippewa | 0.0 /100 | #298 | Tragic 30.6% |
Demographics Similar to Alaska Natives by Bachelor's Degree
In terms of bachelor's degree, the demographic groups most similar to Alaska Natives are Seminole (29.4%, a difference of 0.18%), Choctaw (29.4%, a difference of 0.24%), Shoshone (29.3%, a difference of 0.29%), Cheyenne (29.4%, a difference of 0.31%), and Immigrants from Cabo Verde (29.2%, a difference of 0.37%).
| Demographics | Rating | Rank | Bachelor's Degree |
| Immigrants | Yemen | 0.0 /100 | #306 | Tragic 29.9% |
| Nepalese | 0.0 /100 | #307 | Tragic 29.9% |
| Cajuns | 0.0 /100 | #308 | Tragic 29.6% |
| Hispanics or Latinos | 0.0 /100 | #309 | Tragic 29.6% |
| Cheyenne | 0.0 /100 | #310 | Tragic 29.4% |
| Choctaw | 0.0 /100 | #311 | Tragic 29.4% |
| Seminole | 0.0 /100 | #312 | Tragic 29.4% |
| Alaska Natives | 0.0 /100 | #313 | Tragic 29.4% |
| Shoshone | 0.0 /100 | #314 | Tragic 29.3% |
| Immigrants | Cabo Verde | 0.0 /100 | #315 | Tragic 29.2% |
| Sioux | 0.0 /100 | #316 | Tragic 29.1% |
| Colville | 0.0 /100 | #317 | Tragic 29.0% |
| Yaqui | 0.0 /100 | #318 | Tragic 29.0% |
| Creek | 0.0 /100 | #319 | Tragic 28.9% |
| Kiowa | 0.0 /100 | #320 | Tragic 28.8% |