Blackfeet vs Mongolian 8th Grade
COMPARE
Blackfeet
Mongolian
8th Grade
8th Grade Comparison
Blackfeet
Mongolians
96.0%
8TH GRADE
80.8/ 100
METRIC RATING
151st/ 347
METRIC RANK
95.8%
8TH GRADE
53.0/ 100
METRIC RATING
173rd/ 347
METRIC RANK
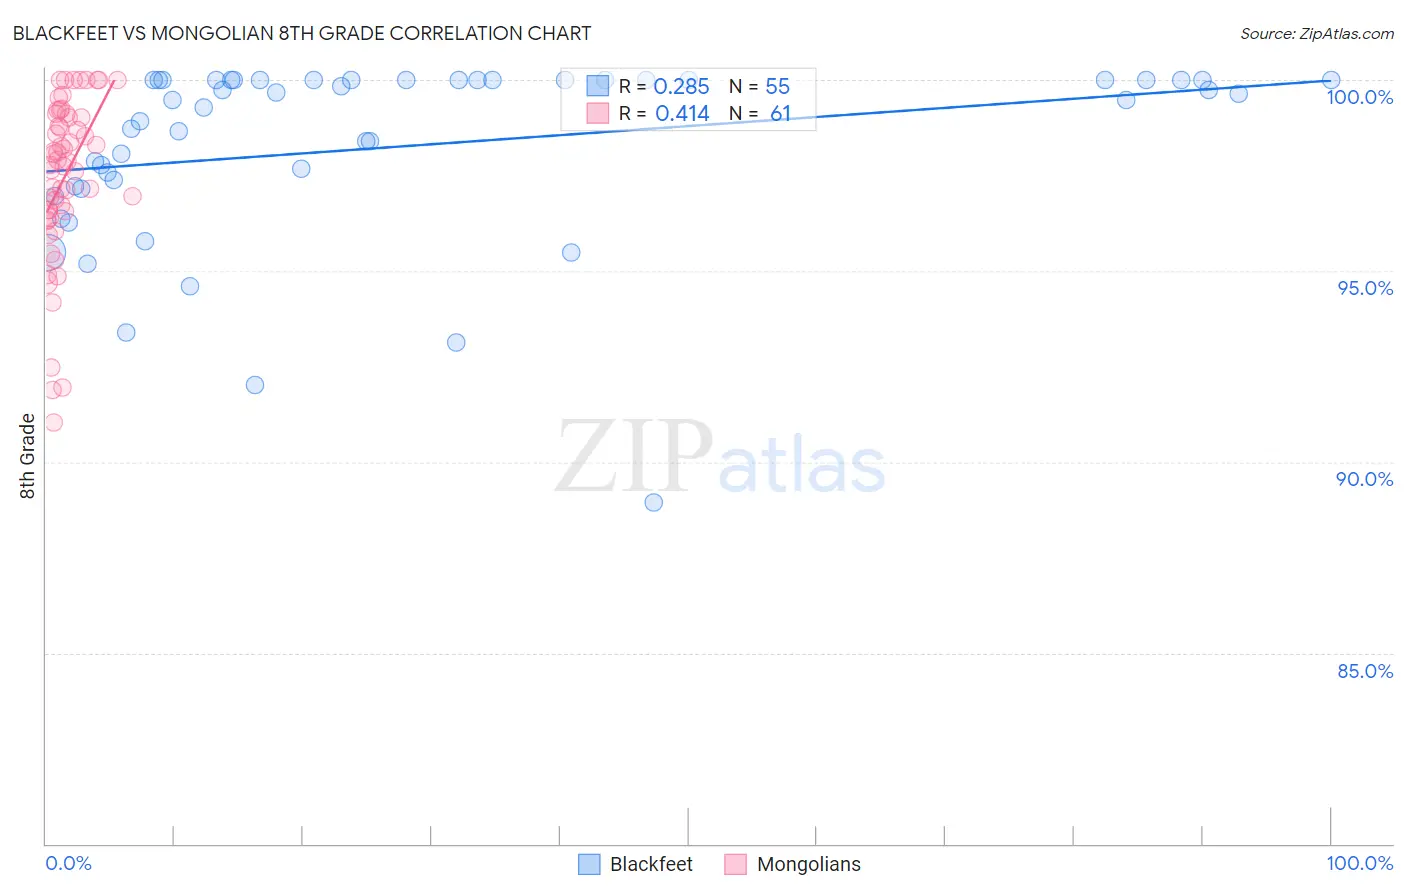
Blackfeet vs Mongolian 8th Grade Correlation Chart
The statistical analysis conducted on geographies consisting of 309,580,893 people shows a weak positive correlation between the proportion of Blackfeet and percentage of population with at least 8th grade education in the United States with a correlation coefficient (R) of 0.285 and weighted average of 96.0%. Similarly, the statistical analysis conducted on geographies consisting of 140,362,004 people shows a moderate positive correlation between the proportion of Mongolians and percentage of population with at least 8th grade education in the United States with a correlation coefficient (R) of 0.414 and weighted average of 95.8%, a difference of 0.21%.
8th Grade Correlation Summary
| Measurement | Blackfeet | Mongolian |
| Minimum | 88.9% | 91.0% |
| Maximum | 100.0% | 100.0% |
| Range | 11.1% | 9.0% |
| Mean | 98.3% | 97.4% |
| Median | 99.5% | 97.9% |
| Interquartile 25% (IQ1) | 97.2% | 96.5% |
| Interquartile 75% (IQ3) | 100.0% | 99.1% |
| Interquartile Range (IQR) | 2.8% | 2.6% |
| Standard Deviation (Sample) | 2.4% | 2.1% |
| Standard Deviation (Population) | 2.4% | 2.1% |
Similar Demographics by 8th Grade
Demographics Similar to Blackfeet by 8th Grade
In terms of 8th grade, the demographic groups most similar to Blackfeet are Immigrants from Russia (96.0%, a difference of 0.0%), French American Indian (96.0%, a difference of 0.0%), Immigrants from Israel (96.0%, a difference of 0.010%), Immigrants from Jordan (95.9%, a difference of 0.010%), and Hopi (95.9%, a difference of 0.010%).
| Demographics | Rating | Rank | 8th Grade |
| Immigrants | Belarus | 84.8 /100 | #144 | Excellent 96.0% |
| Lumbee | 84.1 /100 | #145 | Excellent 96.0% |
| Israelis | 84.1 /100 | #146 | Excellent 96.0% |
| Colville | 84.0 /100 | #147 | Excellent 96.0% |
| Albanians | 83.1 /100 | #148 | Excellent 96.0% |
| Immigrants | Israel | 81.3 /100 | #149 | Excellent 96.0% |
| Immigrants | Russia | 80.9 /100 | #150 | Excellent 96.0% |
| Blackfeet | 80.8 /100 | #151 | Excellent 96.0% |
| French American Indians | 80.6 /100 | #152 | Excellent 96.0% |
| Immigrants | Jordan | 79.5 /100 | #153 | Good 95.9% |
| Hopi | 79.4 /100 | #154 | Good 95.9% |
| Kenyans | 74.5 /100 | #155 | Good 95.9% |
| Ugandans | 74.1 /100 | #156 | Good 95.9% |
| Immigrants | Taiwan | 70.5 /100 | #157 | Good 95.9% |
| Arabs | 69.4 /100 | #158 | Good 95.9% |
Demographics Similar to Mongolians by 8th Grade
In terms of 8th grade, the demographic groups most similar to Mongolians are Chilean (95.7%, a difference of 0.020%), Immigrants from Albania (95.7%, a difference of 0.020%), Egyptian (95.8%, a difference of 0.030%), Immigrants from Korea (95.8%, a difference of 0.030%), and Pakistani (95.7%, a difference of 0.030%).
| Demographics | Rating | Rank | 8th Grade |
| Immigrants | Poland | 61.1 /100 | #166 | Good 95.8% |
| Spaniards | 60.0 /100 | #167 | Good 95.8% |
| Immigrants | Ukraine | 59.5 /100 | #168 | Average 95.8% |
| Immigrants | Iran | 58.6 /100 | #169 | Average 95.8% |
| Ute | 58.5 /100 | #170 | Average 95.8% |
| Egyptians | 58.2 /100 | #171 | Average 95.8% |
| Immigrants | Korea | 57.9 /100 | #172 | Average 95.8% |
| Mongolians | 53.0 /100 | #173 | Average 95.8% |
| Chileans | 50.0 /100 | #174 | Average 95.7% |
| Immigrants | Albania | 49.6 /100 | #175 | Average 95.7% |
| Pakistanis | 48.8 /100 | #176 | Average 95.7% |
| Marshallese | 47.6 /100 | #177 | Average 95.7% |
| Venezuelans | 47.5 /100 | #178 | Average 95.7% |
| Immigrants | Brazil | 45.4 /100 | #179 | Average 95.7% |
| Iraqis | 40.5 /100 | #180 | Average 95.7% |