Blackfeet vs Immigrants from Uganda High School Diploma
COMPARE
Blackfeet
Immigrants from Uganda
High School Diploma
High School Diploma Comparison
Blackfeet
Immigrants from Uganda
88.1%
HIGH SCHOOL DIPLOMA
4.2/ 100
METRIC RATING
230th/ 347
METRIC RANK
88.9%
HIGH SCHOOL DIPLOMA
32.6/ 100
METRIC RATING
189th/ 347
METRIC RANK
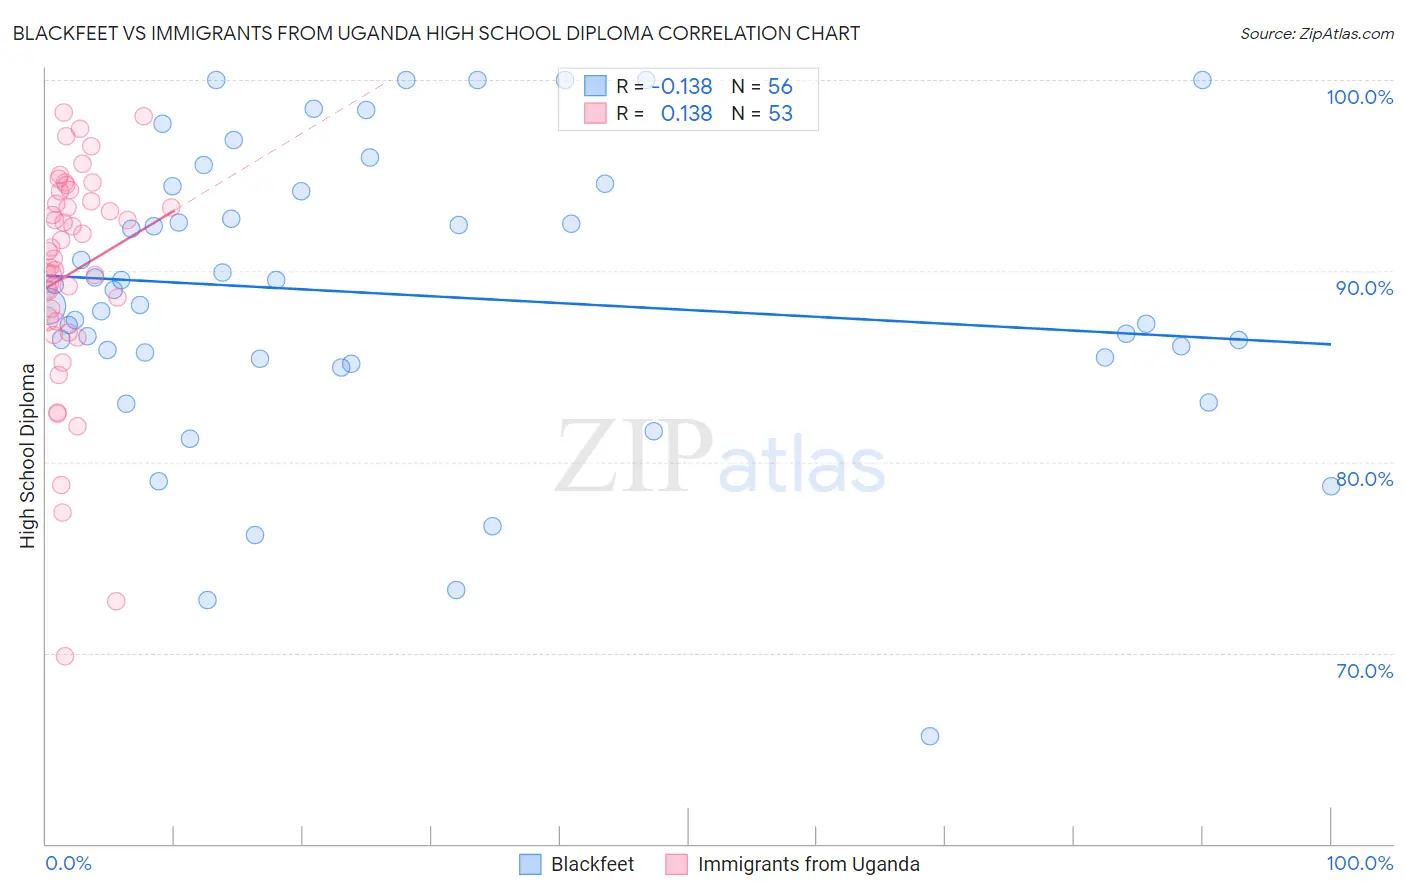
Blackfeet vs Immigrants from Uganda High School Diploma Correlation Chart
The statistical analysis conducted on geographies consisting of 309,582,193 people shows a poor negative correlation between the proportion of Blackfeet and percentage of population with at least high school diploma education in the United States with a correlation coefficient (R) of -0.138 and weighted average of 88.1%. Similarly, the statistical analysis conducted on geographies consisting of 125,981,524 people shows a poor positive correlation between the proportion of Immigrants from Uganda and percentage of population with at least high school diploma education in the United States with a correlation coefficient (R) of 0.138 and weighted average of 88.9%, a difference of 0.91%.
High School Diploma Correlation Summary
| Measurement | Blackfeet | Immigrants from Uganda |
| Minimum | 65.6% | 69.8% |
| Maximum | 100.0% | 98.3% |
| Range | 34.4% | 28.5% |
| Mean | 88.8% | 89.9% |
| Median | 88.6% | 91.0% |
| Interquartile 25% (IQ1) | 85.4% | 87.4% |
| Interquartile 75% (IQ3) | 94.3% | 93.9% |
| Interquartile Range (IQR) | 8.9% | 6.5% |
| Standard Deviation (Sample) | 7.6% | 6.0% |
| Standard Deviation (Population) | 7.5% | 5.9% |
Similar Demographics by High School Diploma
Demographics Similar to Blackfeet by High School Diploma
In terms of high school diploma, the demographic groups most similar to Blackfeet are Colombian (88.1%, a difference of 0.040%), Nigerian (88.2%, a difference of 0.080%), Kiowa (88.2%, a difference of 0.090%), Immigrants from Middle Africa (88.0%, a difference of 0.090%), and Immigrants from Liberia (88.2%, a difference of 0.10%).
| Demographics | Rating | Rank | High School Diploma |
| Immigrants | Zaire | 7.6 /100 | #223 | Tragic 88.3% |
| Shoshone | 7.0 /100 | #224 | Tragic 88.3% |
| Creek | 6.9 /100 | #225 | Tragic 88.3% |
| Uruguayans | 5.6 /100 | #226 | Tragic 88.2% |
| Immigrants | Liberia | 5.5 /100 | #227 | Tragic 88.2% |
| Kiowa | 5.3 /100 | #228 | Tragic 88.2% |
| Nigerians | 5.2 /100 | #229 | Tragic 88.2% |
| Blackfeet | 4.2 /100 | #230 | Tragic 88.1% |
| Colombians | 3.8 /100 | #231 | Tragic 88.1% |
| Immigrants | Middle Africa | 3.4 /100 | #232 | Tragic 88.0% |
| Immigrants | Panama | 3.1 /100 | #233 | Tragic 88.0% |
| Immigrants | Thailand | 3.1 /100 | #234 | Tragic 88.0% |
| Immigrants | Bahamas | 2.9 /100 | #235 | Tragic 88.0% |
| Sub-Saharan Africans | 2.8 /100 | #236 | Tragic 87.9% |
| Taiwanese | 2.8 /100 | #237 | Tragic 87.9% |
Demographics Similar to Immigrants from Uganda by High School Diploma
In terms of high school diploma, the demographic groups most similar to Immigrants from Uganda are Immigrants from Sudan (88.9%, a difference of 0.010%), Immigrants from Chile (88.9%, a difference of 0.010%), Immigrants from Ethiopia (88.9%, a difference of 0.030%), Immigrants from Eastern Africa (88.9%, a difference of 0.050%), and Guamanian/Chamorro (88.9%, a difference of 0.050%).
| Demographics | Rating | Rank | High School Diploma |
| Spaniards | 43.4 /100 | #182 | Average 89.1% |
| Potawatomi | 42.5 /100 | #183 | Average 89.0% |
| Immigrants | Syria | 39.2 /100 | #184 | Fair 89.0% |
| Ethiopians | 37.0 /100 | #185 | Fair 89.0% |
| Immigrants | Eastern Africa | 35.8 /100 | #186 | Fair 88.9% |
| Guamanians/Chamorros | 35.5 /100 | #187 | Fair 88.9% |
| Immigrants | Sudan | 33.4 /100 | #188 | Fair 88.9% |
| Immigrants | Uganda | 32.6 /100 | #189 | Fair 88.9% |
| Immigrants | Chile | 31.9 /100 | #190 | Fair 88.9% |
| Immigrants | Ethiopia | 30.9 /100 | #191 | Fair 88.9% |
| Moroccans | 29.5 /100 | #192 | Fair 88.8% |
| Immigrants | Oceania | 26.9 /100 | #193 | Fair 88.8% |
| Immigrants | Venezuela | 25.8 /100 | #194 | Fair 88.8% |
| Afghans | 23.9 /100 | #195 | Fair 88.8% |
| Immigrants | Southern Europe | 23.4 /100 | #196 | Fair 88.7% |