Blackfeet vs Immigrants from Ghana 9th Grade

COMPARE

Blackfeet
Race
Ancestry
AfghanAfricanAlaska NativeAlaskan AthabascanAlbanianAleutAlsatianAmericanApacheArabArapahoArgentineanArmenianAssyrian/Chaldean/SyriacAustralianAustrianBahamianBangladeshiBarbadianBasqueBelgianBelizeanBermudanBhutaneseBlackfeetBolivianBrazilianBritishBritish West IndianBulgarianBurmeseCajunCambodianCanadianCape VerdeanCarpatho RusynCelticCentral AmericanCentral American IndianCherokeeCheyenneChickasawChileanChineseChippewaChoctawColombianColvilleComancheCosta RicanCreeCreekCroatianCrowCubanCypriotCzechCzechoslovakianDanishDelawareDominicanDutchDutch West IndianEastern EuropeanEcuadorianEgyptianEnglishEstonianEthiopianEuropeanFijianFilipinoFinnishFrenchFrench American IndianFrench CanadianGermanGerman RussianGhanaianGreekGuamanian/ChamorroGuatemalanGuyaneseHaitianHmongHonduranHopiHoumaHungarianIcelanderIndian (Asian)IndonesianInupiatIranianIraqiIrishIroquoisIsraeliItalianJamaicanJapaneseJordanianKenyanKiowaKoreanLaotianLatvianLebaneseLiberianLithuanianLumbeeLuxembourgerMacedonianMalaysianMalteseMarshalleseMenomineeMexicanMexican American IndianMongolianMoroccanNative HawaiianNavajoNepaleseNew ZealanderNicaraguanNigerianNorthern EuropeanNorwegianOkinawanOsageOttawaPaiutePakistaniPalestinianPanamanianParaguayanPennsylvania GermanPeruvianPimaPolishPortuguesePotawatomiPuebloPuerto RicanPuget Sound SalishRomanianRussianSalvadoranSamoanScandinavianScotch-IrishScottishSeminoleSenegaleseSerbianShoshoneSierra LeoneanSiouxSlavicSlovakSloveneSomaliSouth AfricanSouth AmericanSouth American IndianSoviet UnionSpaniardSpanishSpanish AmericanSpanish American IndianSri LankanSubsaharan AfricanSudaneseSwedishSwissSyrianTaiwaneseThaiTlingit-HaidaTohono O'OdhamTonganTrinidadian and TobagonianTsimshianTurkishU.S. Virgin IslanderUgandanUkrainianUruguayanUteVenezuelanVietnameseWelshWest IndianYakamaYaquiYugoslavianYumanYup'ikZimbabwean
Immigration
NonimmigrantsImmigrantsAfghanistanAfricaAlbaniaArgentinaArmeniaAsiaAustraliaAustriaBahamasBangladeshBarbadosBelarusBelgiumBelizeBoliviaBosnia and HerzegovinaBrazilBulgariaBurma/MyanmarCabo VerdeCambodiaCameroonCanadaCaribbeanCentral AmericaChileChinaColombiaCongoCosta RicaCroatiaCubaCzechoslovakiaDenmarkDominicaDominican RepublicEastern AfricaEastern AsiaEastern EuropeEcuadorEgyptEl SalvadorEnglandEritreaEthiopiaEuropeFijiFranceGermanyGreeceGrenadaGuatemalaGuyanaHaitiHondurasHong KongHungaryIndiaIndonesiaIranIraqIrelandIsraelItalyJamaicaJapanJordanKazakhstanKenyaKoreaKuwaitLaosLatin AmericaLatviaLebanonLiberiaLithuaniaMalaysiaMexicoMicronesiaMiddle AfricaMoldovaMoroccoNepalNetherlandsNicaraguaNigeriaNorth AmericaNorth MacedoniaNorthern AfricaNorthern EuropeNorwayOceaniaPakistanPanamaPeruPhilippinesPolandPortugalRomaniaRussiaSaudi ArabiaScotlandSenegalSerbiaSierra LeoneSingaporeSomaliaSouth AfricaSouth AmericaSouth Central AsiaSouth Eastern AsiaSouthern EuropeSpainSri LankaSt. Vincent and the GrenadinesSudanSwedenSwitzerlandSyriaTaiwanThailandTrinidad and TobagoTurkeyUgandaUkraineUruguayUzbekistanVenezuelaVietnamWest IndiesWestern AfricaWestern AsiaWestern EuropeYemenZaireZimbabweAzores
Immigrants from Ghana
Race
Ancestry
AfghanAfricanAlaska NativeAlaskan AthabascanAlbanianAleutAlsatianAmericanApacheArabArapahoArgentineanArmenianAssyrian/Chaldean/SyriacAustralianAustrianBahamianBangladeshiBarbadianBasqueBelgianBelizeanBermudanBhutaneseBolivianBrazilianBritishBritish West IndianBulgarianBurmeseCajunCambodianCanadianCape VerdeanCarpatho RusynCelticCentral AmericanCentral American IndianCherokeeCheyenneChickasawChileanChineseChippewaChoctawColombianColvilleComancheCosta RicanCreeCreekCroatianCrowCubanCypriotCzechCzechoslovakianDanishDelawareDominicanDutchDutch West IndianEastern EuropeanEcuadorianEgyptianEnglishEstonianEthiopianEuropeanFijianFilipinoFinnishFrenchFrench American IndianFrench CanadianGermanGerman RussianGhanaianGreekGuamanian/ChamorroGuatemalanGuyaneseHaitianHmongHonduranHopiHoumaHungarianIcelanderIndian (Asian)IndonesianInupiatIranianIraqiIrishIroquoisIsraeliItalianJamaicanJapaneseJordanianKenyanKiowaKoreanLaotianLatvianLebaneseLiberianLithuanianLumbeeLuxembourgerMacedonianMalaysianMalteseMarshalleseMenomineeMexicanMexican American IndianMongolianMoroccanNative HawaiianNavajoNepaleseNew ZealanderNicaraguanNigerianNorthern EuropeanNorwegianOkinawanOsageOttawaPaiutePakistaniPalestinianPanamanianParaguayanPennsylvania GermanPeruvianPimaPolishPortuguesePotawatomiPuebloPuerto RicanPuget Sound SalishRomanianRussianSalvadoranSamoanScandinavianScotch-IrishScottishSeminoleSenegaleseSerbianShoshoneSierra LeoneanSiouxSlavicSlovakSloveneSomaliSouth AfricanSouth AmericanSouth American IndianSoviet UnionSpaniardSpanishSpanish AmericanSpanish American IndianSri LankanSubsaharan AfricanSudaneseSwedishSwissSyrianTaiwaneseThaiTlingit-HaidaTohono O'OdhamTonganTrinidadian and TobagonianTsimshianTurkishU.S. Virgin IslanderUgandanUkrainianUruguayanUteVenezuelanVietnameseWelshWest IndianYakamaYaquiYugoslavianYumanYup'ikZimbabwean
Immigration
NonimmigrantsImmigrantsAfghanistanAfricaAlbaniaArgentinaArmeniaAsiaAustraliaAustriaBahamasBangladeshBarbadosBelarusBelgiumBelizeBoliviaBosnia and HerzegovinaBrazilBulgariaBurma/MyanmarCabo VerdeCambodiaCameroonCanadaCaribbeanCentral AmericaChileChinaColombiaCongoCosta RicaCroatiaCubaCzechoslovakiaDenmarkDominicaDominican RepublicEastern AfricaEastern AsiaEastern EuropeEcuadorEgyptEl SalvadorEnglandEritreaEthiopiaEuropeFijiFranceGermanyGhanaGreeceGrenadaGuatemalaGuyanaHaitiHondurasHong KongHungaryIndiaIndonesiaIranIraqIrelandIsraelItalyJamaicaJapanJordanKazakhstanKenyaKoreaKuwaitLaosLatin AmericaLatviaLebanonLiberiaLithuaniaMalaysiaMexicoMicronesiaMiddle AfricaMoldovaMoroccoNepalNetherlandsNicaraguaNigeriaNorth AmericaNorth MacedoniaNorthern AfricaNorthern EuropeNorwayOceaniaPakistanPanamaPeruPhilippinesPolandPortugalRomaniaRussiaSaudi ArabiaScotlandSenegalSerbiaSierra LeoneSingaporeSomaliaSouth AfricaSouth AmericaSouth Central AsiaSouth Eastern AsiaSouthern EuropeSpainSri LankaSt. Vincent and the GrenadinesSudanSwedenSwitzerlandSyriaTaiwanThailandTrinidad and TobagoTurkeyUgandaUkraineUruguayUzbekistanVenezuelaVietnamWest IndiesWestern AfricaWestern AsiaWestern EuropeYemenZaireZimbabweAzores
9th Grade
Income
Poverty
Unemployment
Labor Participation
Family Structure
Vehicle Availability
Education Level
Disability

9th Grade Comparison

Blackfeet

Immigrants from Ghana

Good
Tragic
95.0%
9TH GRADE
62.6/ 100
METRIC RATING
165th/ 347
METRIC RANK
93.8%
9TH GRADE
0.2/ 100
METRIC RATING
271st/ 347
METRIC RANK

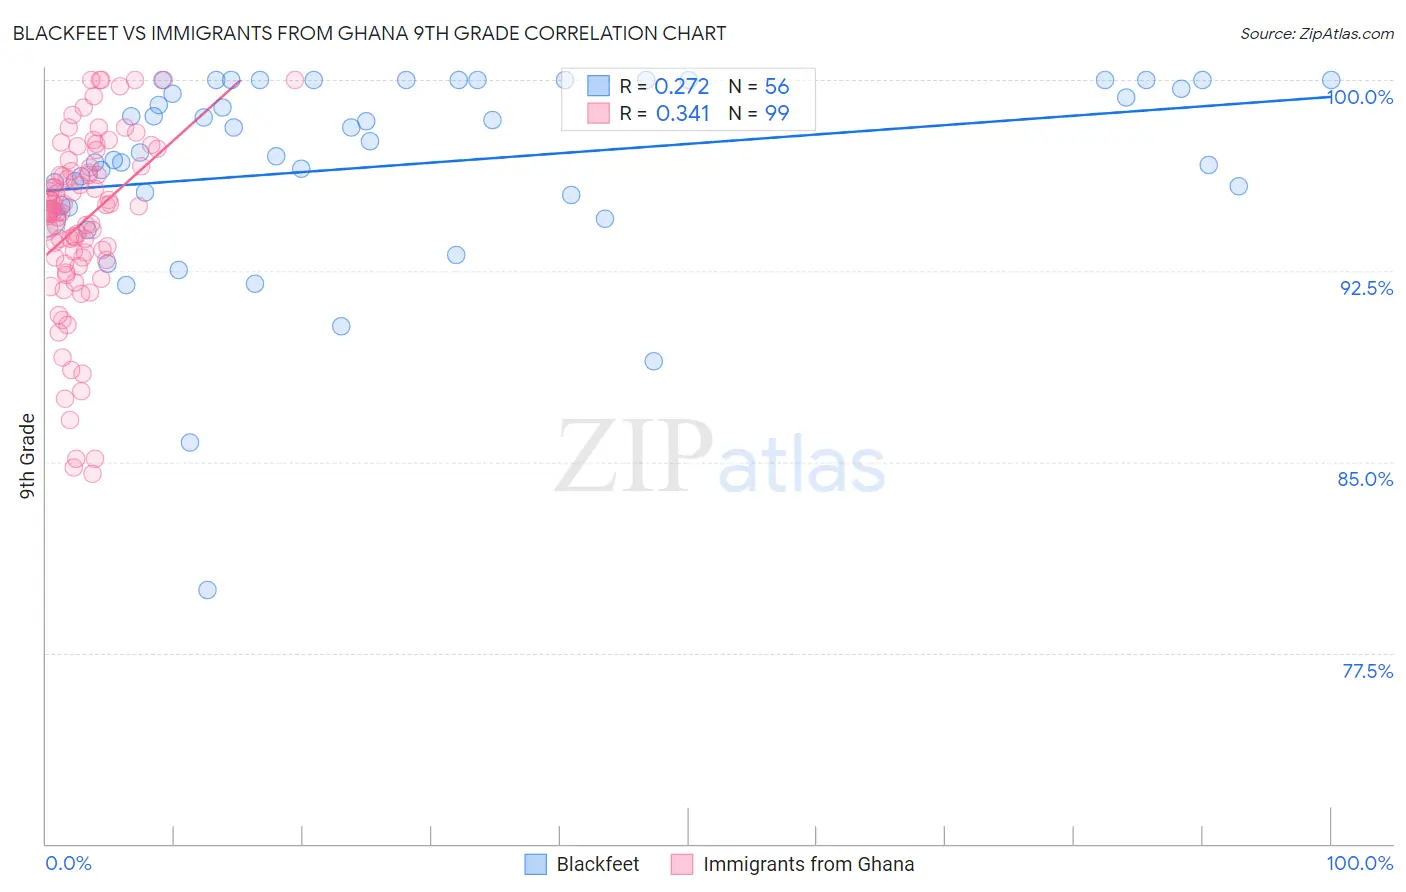
Blackfeet vs Immigrants from Ghana 9th Grade Correlation Chart

The statistical analysis conducted on geographies consisting of 309,582,133 people shows a weak positive correlation between the proportion of Blackfeet and percentage of population with at least 9th grade education in the United States with a correlation coefficient (R) of 0.272 and weighted average of 95.0%. Similarly, the statistical analysis conducted on geographies consisting of 199,952,023 people shows a mild positive correlation between the proportion of Immigrants from Ghana and percentage of population with at least 9th grade education in the United States with a correlation coefficient (R) of 0.341 and weighted average of 93.8%, a difference of 1.3%.
Blackfeet vs Immigrants from Ghana 9th Grade

9th Grade Correlation Summary

MeasurementBlackfeetImmigrants from Ghana
Minimum80.0%84.5%
Maximum100.0%100.0%
Range20.0%15.5%
Mean96.7%94.4%
Median97.4%94.8%
Interquartile 25% (IQ1)95.3%92.9%
Interquartile 75% (IQ3)100.0%96.6%
Interquartile Range (IQR)4.7%3.6%
Standard Deviation (Sample)3.9%3.5%
Standard Deviation (Population)3.9%3.5%

Similar Demographics by 9th Grade

Demographics Similar to Blackfeet by 9th Grade

In terms of 9th grade, the demographic groups most similar to Blackfeet are Ute (95.0%, a difference of 0.0%), Pakistani (95.0%, a difference of 0.010%), Venezuelan (95.0%, a difference of 0.010%), Immigrants from Brazil (95.0%, a difference of 0.010%), and Chilean (95.0%, a difference of 0.020%).
DemographicsRating | Rank9th Grade
Egyptians
70.1
/100
|
#158
Good
95.0%
Immigrants | Ukraine
67.4
/100
|
#159
Good
95.0%
Immigrants | Italy
66.6
/100
|
#160
Good
95.0%
French American Indians
66.5
/100
|
#161
Good
95.0%
Bermudans
65.8
/100
|
#162
Good
95.0%
Pakistanis
64.1
/100
|
#163
Good
95.0%
Venezuelans
63.6
/100
|
#164
Good
95.0%
Blackfeet
62.6
/100
|
#165
Good
95.0%
Ute
62.6
/100
|
#166
Good
95.0%
Immigrants | Brazil
61.1
/100
|
#167
Good
95.0%
Chileans
60.7
/100
|
#168
Good
95.0%
Spaniards
59.6
/100
|
#169
Average
94.9%
Alsatians
58.6
/100
|
#170
Average
94.9%
Colville
58.5
/100
|
#171
Average
94.9%
Iraqis
54.0
/100
|
#172
Average
94.9%

Demographics Similar to Immigrants from Ghana by 9th Grade

In terms of 9th grade, the demographic groups most similar to Immigrants from Ghana are Immigrants from Western Africa (93.8%, a difference of 0.010%), Yuman (93.8%, a difference of 0.020%), Immigrants from South America (93.8%, a difference of 0.020%), Peruvian (93.8%, a difference of 0.020%), and Immigrants from Uruguay (93.8%, a difference of 0.030%).
DemographicsRating | Rank9th Grade
Immigrants | Congo
0.4
/100
|
#264
Tragic
93.9%
Natives/Alaskans
0.4
/100
|
#265
Tragic
93.9%
Navajo
0.3
/100
|
#266
Tragic
93.9%
Armenians
0.3
/100
|
#267
Tragic
93.9%
Immigrants | Bolivia
0.3
/100
|
#268
Tragic
93.9%
Immigrants | Uruguay
0.2
/100
|
#269
Tragic
93.8%
Yuman
0.2
/100
|
#270
Tragic
93.8%
Immigrants | Ghana
0.2
/100
|
#271
Tragic
93.8%
Immigrants | Western Africa
0.2
/100
|
#272
Tragic
93.8%
Immigrants | South America
0.2
/100
|
#273
Tragic
93.8%
Peruvians
0.2
/100
|
#274
Tragic
93.8%
Immigrants | Colombia
0.2
/100
|
#275
Tragic
93.8%
West Indians
0.2
/100
|
#276
Tragic
93.7%
Immigrants | Philippines
0.1
/100
|
#277
Tragic
93.7%
Immigrants | Eritrea
0.1
/100
|
#278
Tragic
93.7%