Blackfeet vs Bermudan 10th Grade
COMPARE
Blackfeet
Bermudan
10th Grade
10th Grade Comparison
Blackfeet
Bermudans
93.7%
10TH GRADE
42.8/ 100
METRIC RATING
180th/ 347
METRIC RANK
93.9%
10TH GRADE
71.0/ 100
METRIC RATING
158th/ 347
METRIC RANK
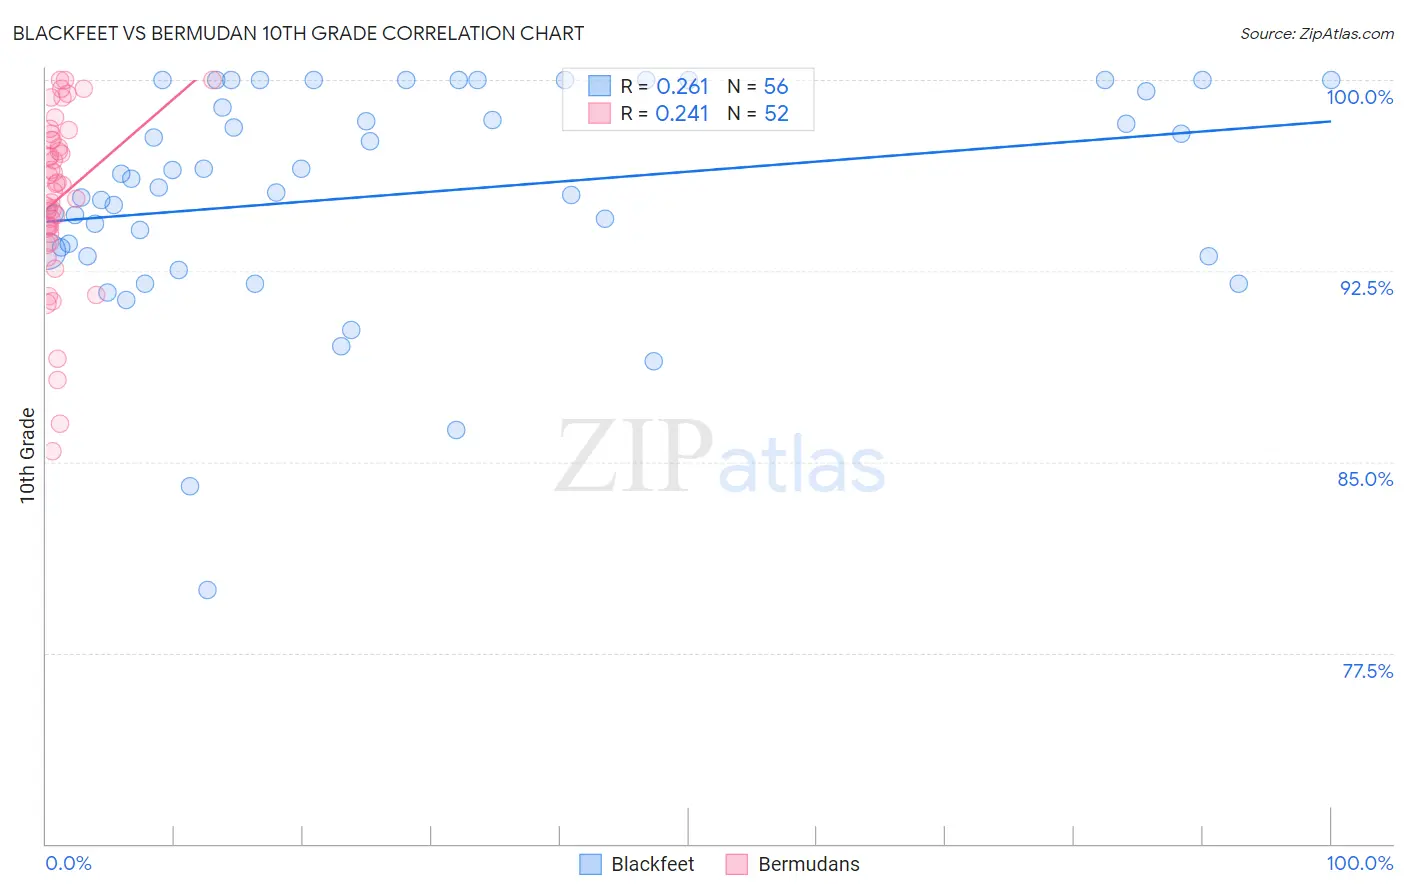
Blackfeet vs Bermudan 10th Grade Correlation Chart
The statistical analysis conducted on geographies consisting of 309,582,133 people shows a weak positive correlation between the proportion of Blackfeet and percentage of population with at least 10th grade education in the United States with a correlation coefficient (R) of 0.261 and weighted average of 93.7%. Similarly, the statistical analysis conducted on geographies consisting of 55,730,379 people shows a weak positive correlation between the proportion of Bermudans and percentage of population with at least 10th grade education in the United States with a correlation coefficient (R) of 0.241 and weighted average of 93.9%, a difference of 0.27%.
10th Grade Correlation Summary
| Measurement | Blackfeet | Bermudan |
| Minimum | 80.0% | 85.4% |
| Maximum | 100.0% | 100.0% |
| Range | 20.0% | 14.6% |
| Mean | 95.5% | 95.3% |
| Median | 96.0% | 95.8% |
| Interquartile 25% (IQ1) | 93.2% | 94.0% |
| Interquartile 75% (IQ3) | 99.8% | 97.7% |
| Interquartile Range (IQR) | 6.6% | 3.6% |
| Standard Deviation (Sample) | 4.3% | 3.4% |
| Standard Deviation (Population) | 4.3% | 3.3% |
Similar Demographics by 10th Grade
Demographics Similar to Blackfeet by 10th Grade
In terms of 10th grade, the demographic groups most similar to Blackfeet are Immigrants from Northern Africa (93.7%, a difference of 0.010%), Paraguayan (93.7%, a difference of 0.020%), Sierra Leonean (93.7%, a difference of 0.030%), Immigrants from Argentina (93.7%, a difference of 0.040%), and Immigrants from Lebanon (93.7%, a difference of 0.040%).
| Demographics | Rating | Rank | 10th Grade |
| Spaniards | 50.3 /100 | #173 | Average 93.7% |
| Argentineans | 50.0 /100 | #174 | Average 93.7% |
| Immigrants | Nepal | 49.6 /100 | #175 | Average 93.7% |
| Immigrants | Argentina | 47.1 /100 | #176 | Average 93.7% |
| Immigrants | Lebanon | 47.1 /100 | #177 | Average 93.7% |
| Sierra Leoneans | 46.1 /100 | #178 | Average 93.7% |
| Paraguayans | 45.3 /100 | #179 | Average 93.7% |
| Blackfeet | 42.8 /100 | #180 | Average 93.7% |
| Immigrants | Northern Africa | 41.6 /100 | #181 | Average 93.7% |
| Colville | 38.8 /100 | #182 | Fair 93.6% |
| Guamanians/Chamorros | 37.1 /100 | #183 | Fair 93.6% |
| Choctaw | 36.6 /100 | #184 | Fair 93.6% |
| Sudanese | 36.6 /100 | #185 | Fair 93.6% |
| Immigrants | Eastern Asia | 35.1 /100 | #186 | Fair 93.6% |
| Liberians | 34.7 /100 | #187 | Fair 93.6% |
Demographics Similar to Bermudans by 10th Grade
In terms of 10th grade, the demographic groups most similar to Bermudans are Chilean (93.9%, a difference of 0.010%), Pakistani (93.9%, a difference of 0.010%), Assyrian/Chaldean/Syriac (93.9%, a difference of 0.010%), Immigrants from Poland (93.9%, a difference of 0.020%), and Venezuelan (93.9%, a difference of 0.020%).
| Demographics | Rating | Rank | 10th Grade |
| Kenyans | 79.1 /100 | #151 | Good 94.0% |
| Immigrants | Italy | 78.0 /100 | #152 | Good 94.0% |
| Immigrants | Brazil | 75.5 /100 | #153 | Good 94.0% |
| Immigrants | Kenya | 75.3 /100 | #154 | Good 94.0% |
| Spanish | 74.9 /100 | #155 | Good 94.0% |
| Mongolians | 74.4 /100 | #156 | Good 94.0% |
| Kiowa | 73.3 /100 | #157 | Good 93.9% |
| Bermudans | 71.0 /100 | #158 | Good 93.9% |
| Chileans | 70.2 /100 | #159 | Good 93.9% |
| Pakistanis | 70.1 /100 | #160 | Good 93.9% |
| Assyrians/Chaldeans/Syriacs | 69.7 /100 | #161 | Good 93.9% |
| Immigrants | Poland | 69.6 /100 | #162 | Good 93.9% |
| Venezuelans | 69.5 /100 | #163 | Good 93.9% |
| Iraqis | 68.1 /100 | #164 | Good 93.9% |
| Brazilians | 63.6 /100 | #165 | Good 93.8% |