Bhutanese vs Immigrants from Moldova Associate's Degree

COMPARE

Bhutanese
Race
Ancestry
AfghanAfricanAlaska NativeAlaskan AthabascanAlbanianAleutAlsatianAmericanApacheArabArapahoArgentineanArmenianAssyrian/Chaldean/SyriacAustralianAustrianBahamianBangladeshiBarbadianBasqueBelgianBelizeanBermudanBhutaneseBlackfeetBolivianBrazilianBritishBritish West IndianBulgarianBurmeseCajunCambodianCanadianCape VerdeanCarpatho RusynCelticCentral AmericanCentral American IndianCherokeeCheyenneChickasawChileanChineseChippewaChoctawColombianColvilleComancheCosta RicanCreeCreekCroatianCrowCubanCypriotCzechCzechoslovakianDanishDelawareDominicanDutchDutch West IndianEastern EuropeanEcuadorianEgyptianEnglishEstonianEthiopianEuropeanFijianFilipinoFinnishFrenchFrench American IndianFrench CanadianGermanGerman RussianGhanaianGreekGuamanian/ChamorroGuatemalanGuyaneseHaitianHmongHonduranHopiHoumaHungarianIcelanderIndian (Asian)IndonesianInupiatIranianIraqiIrishIroquoisIsraeliItalianJamaicanJapaneseJordanianKenyanKiowaKoreanLaotianLatvianLebaneseLiberianLithuanianLumbeeLuxembourgerMacedonianMalaysianMalteseMarshalleseMenomineeMexicanMexican American IndianMongolianMoroccanNative HawaiianNavajoNepaleseNew ZealanderNicaraguanNigerianNorthern EuropeanNorwegianOkinawanOsageOttawaPaiutePakistaniPalestinianPanamanianParaguayanPennsylvania GermanPeruvianPimaPolishPortuguesePotawatomiPuebloPuerto RicanPuget Sound SalishRomanianRussianSalvadoranSamoanScandinavianScotch-IrishScottishSeminoleSenegaleseSerbianShoshoneSierra LeoneanSiouxSlavicSlovakSloveneSomaliSouth AfricanSouth AmericanSouth American IndianSoviet UnionSpaniardSpanishSpanish AmericanSpanish American IndianSri LankanSubsaharan AfricanSudaneseSwedishSwissSyrianTaiwaneseThaiTlingit-HaidaTohono O'OdhamTonganTrinidadian and TobagonianTsimshianTurkishU.S. Virgin IslanderUgandanUkrainianUruguayanUteVenezuelanVietnameseWelshWest IndianYakamaYaquiYugoslavianYumanYup'ikZimbabwean
Immigration
NonimmigrantsImmigrantsAfghanistanAfricaAlbaniaArgentinaArmeniaAsiaAustraliaAustriaBahamasBangladeshBarbadosBelarusBelgiumBelizeBoliviaBosnia and HerzegovinaBrazilBulgariaBurma/MyanmarCabo VerdeCambodiaCameroonCanadaCaribbeanCentral AmericaChileChinaColombiaCongoCosta RicaCroatiaCubaCzechoslovakiaDenmarkDominicaDominican RepublicEastern AfricaEastern AsiaEastern EuropeEcuadorEgyptEl SalvadorEnglandEritreaEthiopiaEuropeFijiFranceGermanyGhanaGreeceGrenadaGuatemalaGuyanaHaitiHondurasHong KongHungaryIndiaIndonesiaIranIraqIrelandIsraelItalyJamaicaJapanJordanKazakhstanKenyaKoreaKuwaitLaosLatin AmericaLatviaLebanonLiberiaLithuaniaMalaysiaMexicoMicronesiaMiddle AfricaMoroccoNepalNetherlandsNicaraguaNigeriaNorth AmericaNorth MacedoniaNorthern AfricaNorthern EuropeNorwayOceaniaPakistanPanamaPeruPhilippinesPolandPortugalRomaniaRussiaSaudi ArabiaScotlandSenegalSerbiaSierra LeoneSingaporeSomaliaSouth AfricaSouth AmericaSouth Central AsiaSouth Eastern AsiaSouthern EuropeSpainSri LankaSt. Vincent and the GrenadinesSudanSwedenSwitzerlandSyriaTaiwanThailandTrinidad and TobagoTurkeyUgandaUkraineUruguayUzbekistanVenezuelaVietnamWest IndiesWestern AfricaWestern AsiaWestern EuropeYemenZaireZimbabweAzores
Immigrants from Moldova
Race
Ancestry
AfghanAfricanAlaska NativeAlaskan AthabascanAlbanianAleutAlsatianAmericanApacheArabArapahoArgentineanArmenianAssyrian/Chaldean/SyriacAustralianAustrianBahamianBangladeshiBarbadianBasqueBelgianBelizeanBermudanBlackfeetBolivianBrazilianBritishBritish West IndianBulgarianBurmeseCajunCambodianCanadianCape VerdeanCarpatho RusynCelticCentral AmericanCentral American IndianCherokeeCheyenneChickasawChileanChineseChippewaChoctawColombianColvilleComancheCosta RicanCreeCreekCroatianCrowCubanCypriotCzechCzechoslovakianDanishDelawareDominicanDutchDutch West IndianEastern EuropeanEcuadorianEgyptianEnglishEstonianEthiopianEuropeanFijianFilipinoFinnishFrenchFrench American IndianFrench CanadianGermanGerman RussianGhanaianGreekGuamanian/ChamorroGuatemalanGuyaneseHaitianHmongHonduranHopiHoumaHungarianIcelanderIndian (Asian)IndonesianInupiatIranianIraqiIrishIroquoisIsraeliItalianJamaicanJapaneseJordanianKenyanKiowaKoreanLaotianLatvianLebaneseLiberianLithuanianLumbeeLuxembourgerMacedonianMalaysianMalteseMarshalleseMenomineeMexicanMexican American IndianMongolianMoroccanNative HawaiianNavajoNepaleseNew ZealanderNicaraguanNigerianNorthern EuropeanNorwegianOkinawanOsageOttawaPaiutePakistaniPalestinianPanamanianParaguayanPennsylvania GermanPeruvianPimaPolishPortuguesePotawatomiPuebloPuerto RicanPuget Sound SalishRomanianRussianSalvadoranSamoanScandinavianScotch-IrishScottishSeminoleSenegaleseSerbianShoshoneSierra LeoneanSiouxSlavicSlovakSloveneSomaliSouth AfricanSouth AmericanSouth American IndianSoviet UnionSpaniardSpanishSpanish AmericanSpanish American IndianSri LankanSubsaharan AfricanSudaneseSwedishSwissSyrianTaiwaneseThaiTlingit-HaidaTohono O'OdhamTonganTrinidadian and TobagonianTsimshianTurkishU.S. Virgin IslanderUgandanUkrainianUruguayanUteVenezuelanVietnameseWelshWest IndianYakamaYaquiYugoslavianYumanYup'ikZimbabwean
Immigration
NonimmigrantsImmigrantsAfghanistanAfricaAlbaniaArgentinaArmeniaAsiaAustraliaAustriaBahamasBangladeshBarbadosBelarusBelgiumBelizeBoliviaBosnia and HerzegovinaBrazilBulgariaBurma/MyanmarCabo VerdeCambodiaCameroonCanadaCaribbeanCentral AmericaChileChinaColombiaCongoCosta RicaCroatiaCubaCzechoslovakiaDenmarkDominicaDominican RepublicEastern AfricaEastern AsiaEastern EuropeEcuadorEgyptEl SalvadorEnglandEritreaEthiopiaEuropeFijiFranceGermanyGhanaGreeceGrenadaGuatemalaGuyanaHaitiHondurasHong KongHungaryIndiaIndonesiaIranIraqIrelandIsraelItalyJamaicaJapanJordanKazakhstanKenyaKoreaKuwaitLaosLatin AmericaLatviaLebanonLiberiaLithuaniaMalaysiaMexicoMicronesiaMiddle AfricaMoldovaMoroccoNepalNetherlandsNicaraguaNigeriaNorth AmericaNorth MacedoniaNorthern AfricaNorthern EuropeNorwayOceaniaPakistanPanamaPeruPhilippinesPolandPortugalRomaniaRussiaSaudi ArabiaScotlandSenegalSerbiaSierra LeoneSingaporeSomaliaSouth AfricaSouth AmericaSouth Central AsiaSouth Eastern AsiaSouthern EuropeSpainSri LankaSt. Vincent and the GrenadinesSudanSwedenSwitzerlandSyriaTaiwanThailandTrinidad and TobagoTurkeyUgandaUkraineUruguayUzbekistanVenezuelaVietnamWest IndiesWestern AfricaWestern AsiaWestern EuropeYemenZaireZimbabweAzores
Associate's Degree
Income
Poverty
Unemployment
Labor Participation
Family Structure
Vehicle Availability
Education Level
Disability

Associate's Degree Comparison

Bhutanese

Immigrants from Moldova

Exceptional
Exceptional
51.4%
ASSOCIATE'S DEGREE
99.7/ 100
METRIC RATING
62nd/ 347
METRIC RANK
50.2%
ASSOCIATE'S DEGREE
98.8/ 100
METRIC RATING
87th/ 347
METRIC RANK

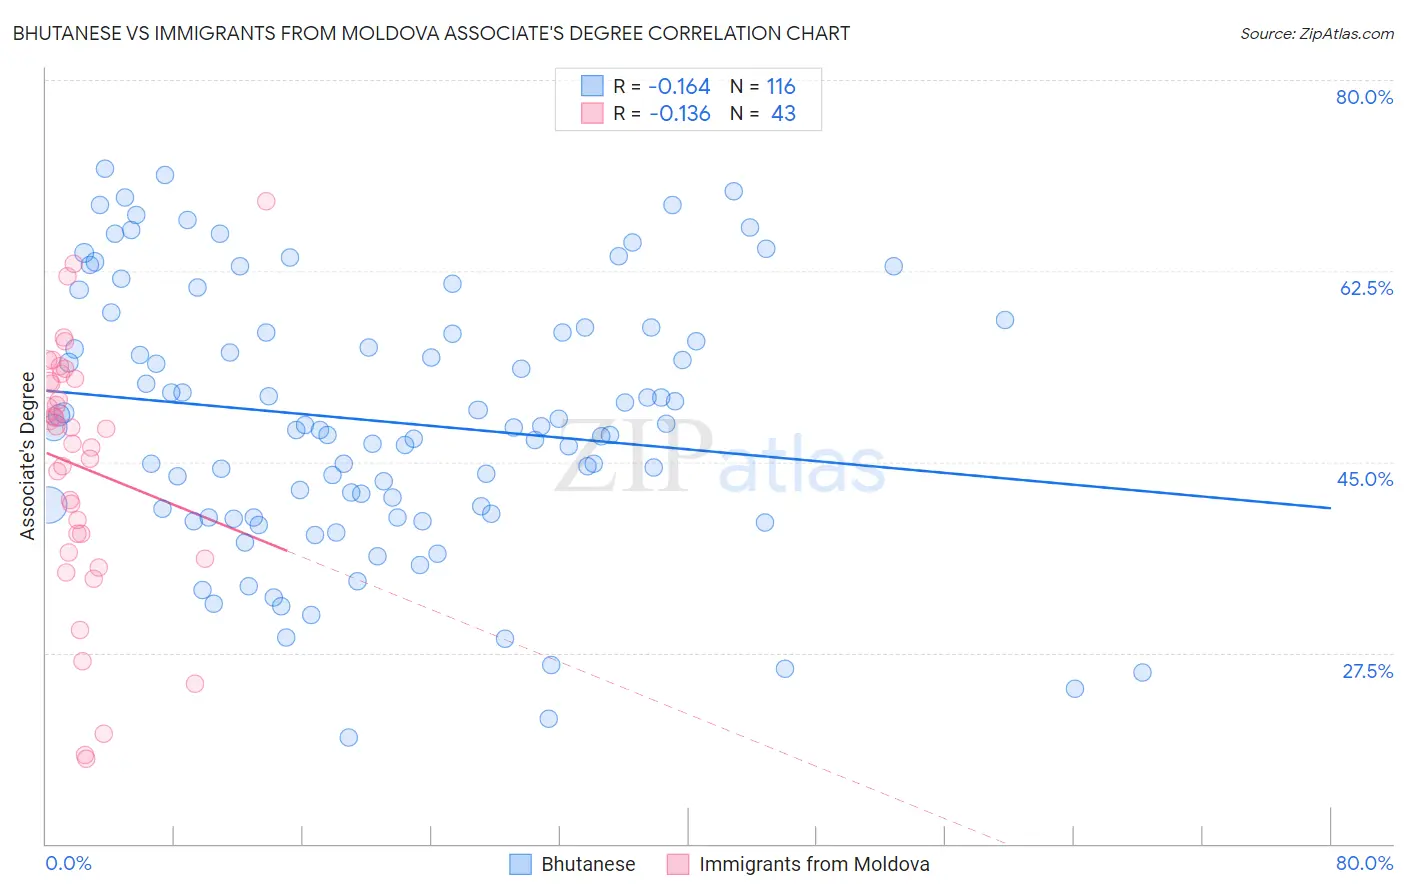
Bhutanese vs Immigrants from Moldova Associate's Degree Correlation Chart

The statistical analysis conducted on geographies consisting of 455,542,651 people shows a poor negative correlation between the proportion of Bhutanese and percentage of population with at least associate's degree education in the United States with a correlation coefficient (R) of -0.164 and weighted average of 51.4%. Similarly, the statistical analysis conducted on geographies consisting of 124,396,308 people shows a poor negative correlation between the proportion of Immigrants from Moldova and percentage of population with at least associate's degree education in the United States with a correlation coefficient (R) of -0.136 and weighted average of 50.2%, a difference of 2.5%.
Bhutanese vs Immigrants from Moldova Associate's Degree

Associate's Degree Correlation Summary

MeasurementBhutaneseImmigrants from Moldova
Minimum19.7%17.8%
Maximum71.8%68.9%
Range52.1%51.1%
Mean48.7%44.5%
Median48.1%48.0%
Interquartile 25% (IQ1)40.1%36.7%
Interquartile 75% (IQ3)57.0%52.6%
Interquartile Range (IQR)16.9%15.8%
Standard Deviation (Sample)12.0%11.8%
Standard Deviation (Population)12.0%11.6%

Similar Demographics by Associate's Degree

Demographics Similar to Bhutanese by Associate's Degree

In terms of associate's degree, the demographic groups most similar to Bhutanese are Immigrants from Kazakhstan (51.4%, a difference of 0.0%), South African (51.4%, a difference of 0.050%), Immigrants from Netherlands (51.4%, a difference of 0.13%), Immigrants from Bolivia (51.5%, a difference of 0.15%), and Zimbabwean (51.3%, a difference of 0.16%).
DemographicsRating | RankAssociate's Degree
Australians
99.8
/100
|
#55
Exceptional
51.9%
Immigrants | Czechoslovakia
99.8
/100
|
#56
Exceptional
51.9%
Paraguayans
99.8
/100
|
#57
Exceptional
51.8%
New Zealanders
99.8
/100
|
#58
Exceptional
51.8%
Immigrants | Serbia
99.8
/100
|
#59
Exceptional
51.7%
Immigrants | Bolivia
99.7
/100
|
#60
Exceptional
51.5%
Immigrants | Kazakhstan
99.7
/100
|
#61
Exceptional
51.4%
Bhutanese
99.7
/100
|
#62
Exceptional
51.4%
South Africans
99.7
/100
|
#63
Exceptional
51.4%
Immigrants | Netherlands
99.7
/100
|
#64
Exceptional
51.4%
Zimbabweans
99.7
/100
|
#65
Exceptional
51.3%
Immigrants | Europe
99.7
/100
|
#66
Exceptional
51.3%
Argentineans
99.6
/100
|
#67
Exceptional
51.2%
Immigrants | Indonesia
99.5
/100
|
#68
Exceptional
51.0%
Egyptians
99.5
/100
|
#69
Exceptional
50.9%

Demographics Similar to Immigrants from Moldova by Associate's Degree

In terms of associate's degree, the demographic groups most similar to Immigrants from Moldova are Immigrants from Canada (50.1%, a difference of 0.070%), Immigrants from Western Europe (50.1%, a difference of 0.080%), Immigrants from Ethiopia (50.1%, a difference of 0.080%), Immigrants from Croatia (50.2%, a difference of 0.12%), and Immigrants from Egypt (50.2%, a difference of 0.13%).
DemographicsRating | RankAssociate's Degree
Armenians
99.1
/100
|
#80
Exceptional
50.4%
Maltese
99.1
/100
|
#81
Exceptional
50.4%
Greeks
98.9
/100
|
#82
Exceptional
50.3%
Immigrants | Uzbekistan
98.9
/100
|
#83
Exceptional
50.3%
Immigrants | Hungary
98.9
/100
|
#84
Exceptional
50.2%
Immigrants | Egypt
98.9
/100
|
#85
Exceptional
50.2%
Immigrants | Croatia
98.9
/100
|
#86
Exceptional
50.2%
Immigrants | Moldova
98.8
/100
|
#87
Exceptional
50.2%
Immigrants | Canada
98.7
/100
|
#88
Exceptional
50.1%
Immigrants | Western Europe
98.7
/100
|
#89
Exceptional
50.1%
Immigrants | Ethiopia
98.7
/100
|
#90
Exceptional
50.1%
Immigrants | Western Asia
98.7
/100
|
#91
Exceptional
50.1%
Immigrants | North America
98.7
/100
|
#92
Exceptional
50.1%
Immigrants | Brazil
98.5
/100
|
#93
Exceptional
50.0%
Laotians
98.4
/100
|
#94
Exceptional
49.9%