Bhutanese vs Honduran No Schooling Completed

COMPARE

Bhutanese
Race
Ancestry
AfghanAfricanAlaska NativeAlaskan AthabascanAlbanianAleutAlsatianAmericanApacheArabArapahoArgentineanArmenianAssyrian/Chaldean/SyriacAustralianAustrianBahamianBangladeshiBarbadianBasqueBelgianBelizeanBermudanBhutaneseBlackfeetBolivianBrazilianBritishBritish West IndianBulgarianBurmeseCajunCambodianCanadianCape VerdeanCarpatho RusynCelticCentral AmericanCentral American IndianCherokeeCheyenneChickasawChileanChineseChippewaChoctawColombianColvilleComancheCosta RicanCreeCreekCroatianCrowCubanCypriotCzechCzechoslovakianDanishDelawareDominicanDutchDutch West IndianEastern EuropeanEcuadorianEgyptianEnglishEstonianEthiopianEuropeanFijianFilipinoFinnishFrenchFrench American IndianFrench CanadianGermanGerman RussianGhanaianGreekGuamanian/ChamorroGuatemalanGuyaneseHaitianHmongHopiHoumaHungarianIcelanderIndian (Asian)IndonesianInupiatIranianIraqiIrishIroquoisIsraeliItalianJamaicanJapaneseJordanianKenyanKiowaKoreanLaotianLatvianLebaneseLiberianLithuanianLumbeeLuxembourgerMacedonianMalaysianMalteseMarshalleseMenomineeMexicanMexican American IndianMongolianMoroccanNative HawaiianNavajoNepaleseNew ZealanderNicaraguanNigerianNorthern EuropeanNorwegianOkinawanOsageOttawaPaiutePakistaniPalestinianPanamanianParaguayanPennsylvania GermanPeruvianPimaPolishPortuguesePotawatomiPuebloPuerto RicanPuget Sound SalishRomanianRussianSalvadoranSamoanScandinavianScotch-IrishScottishSeminoleSenegaleseSerbianShoshoneSierra LeoneanSiouxSlavicSlovakSloveneSomaliSouth AfricanSouth AmericanSouth American IndianSoviet UnionSpaniardSpanishSpanish AmericanSpanish American IndianSri LankanSubsaharan AfricanSudaneseSwedishSwissSyrianTaiwaneseThaiTlingit-HaidaTohono O'OdhamTonganTrinidadian and TobagonianTsimshianTurkishU.S. Virgin IslanderUgandanUkrainianUruguayanUteVenezuelanVietnameseWelshWest IndianYakamaYaquiYugoslavianYumanYup'ikZimbabwean
Immigration
NonimmigrantsImmigrantsAfghanistanAfricaAlbaniaArgentinaArmeniaAsiaAustraliaAustriaBahamasBangladeshBarbadosBelarusBelgiumBelizeBoliviaBosnia and HerzegovinaBrazilBulgariaBurma/MyanmarCabo VerdeCambodiaCameroonCanadaCaribbeanCentral AmericaChileChinaColombiaCongoCosta RicaCroatiaCubaCzechoslovakiaDenmarkDominicaDominican RepublicEastern AfricaEastern AsiaEastern EuropeEcuadorEgyptEl SalvadorEnglandEritreaEthiopiaEuropeFijiFranceGermanyGhanaGreeceGrenadaGuatemalaGuyanaHaitiHondurasHong KongHungaryIndiaIndonesiaIranIraqIrelandIsraelItalyJamaicaJapanJordanKazakhstanKenyaKoreaKuwaitLaosLatin AmericaLatviaLebanonLiberiaLithuaniaMalaysiaMexicoMicronesiaMiddle AfricaMoldovaMoroccoNepalNetherlandsNicaraguaNigeriaNorth AmericaNorth MacedoniaNorthern AfricaNorthern EuropeNorwayOceaniaPakistanPanamaPeruPhilippinesPolandPortugalRomaniaRussiaSaudi ArabiaScotlandSenegalSerbiaSierra LeoneSingaporeSomaliaSouth AfricaSouth AmericaSouth Central AsiaSouth Eastern AsiaSouthern EuropeSpainSri LankaSt. Vincent and the GrenadinesSudanSwedenSwitzerlandSyriaTaiwanThailandTrinidad and TobagoTurkeyUgandaUkraineUruguayUzbekistanVenezuelaVietnamWest IndiesWestern AfricaWestern AsiaWestern EuropeYemenZaireZimbabweAzores
Honduran
Race
Ancestry
AfghanAfricanAlaska NativeAlaskan AthabascanAlbanianAleutAlsatianAmericanApacheArabArapahoArgentineanArmenianAssyrian/Chaldean/SyriacAustralianAustrianBahamianBangladeshiBarbadianBasqueBelgianBelizeanBermudanBlackfeetBolivianBrazilianBritishBritish West IndianBulgarianBurmeseCajunCambodianCanadianCape VerdeanCarpatho RusynCelticCentral AmericanCentral American IndianCherokeeCheyenneChickasawChileanChineseChippewaChoctawColombianColvilleComancheCosta RicanCreeCreekCroatianCrowCubanCypriotCzechCzechoslovakianDanishDelawareDominicanDutchDutch West IndianEastern EuropeanEcuadorianEgyptianEnglishEstonianEthiopianEuropeanFijianFilipinoFinnishFrenchFrench American IndianFrench CanadianGermanGerman RussianGhanaianGreekGuamanian/ChamorroGuatemalanGuyaneseHaitianHmongHonduranHopiHoumaHungarianIcelanderIndian (Asian)IndonesianInupiatIranianIraqiIrishIroquoisIsraeliItalianJamaicanJapaneseJordanianKenyanKiowaKoreanLaotianLatvianLebaneseLiberianLithuanianLumbeeLuxembourgerMacedonianMalaysianMalteseMarshalleseMenomineeMexicanMexican American IndianMongolianMoroccanNative HawaiianNavajoNepaleseNew ZealanderNicaraguanNigerianNorthern EuropeanNorwegianOkinawanOsageOttawaPaiutePakistaniPalestinianPanamanianParaguayanPennsylvania GermanPeruvianPimaPolishPortuguesePotawatomiPuebloPuerto RicanPuget Sound SalishRomanianRussianSalvadoranSamoanScandinavianScotch-IrishScottishSeminoleSenegaleseSerbianShoshoneSierra LeoneanSiouxSlavicSlovakSloveneSomaliSouth AfricanSouth AmericanSouth American IndianSoviet UnionSpaniardSpanishSpanish AmericanSpanish American IndianSri LankanSubsaharan AfricanSudaneseSwedishSwissSyrianTaiwaneseThaiTlingit-HaidaTohono O'OdhamTonganTrinidadian and TobagonianTsimshianTurkishU.S. Virgin IslanderUgandanUkrainianUruguayanUteVenezuelanVietnameseWelshWest IndianYakamaYaquiYugoslavianYumanYup'ikZimbabwean
Immigration
NonimmigrantsImmigrantsAfghanistanAfricaAlbaniaArgentinaArmeniaAsiaAustraliaAustriaBahamasBangladeshBarbadosBelarusBelgiumBelizeBoliviaBosnia and HerzegovinaBrazilBulgariaBurma/MyanmarCabo VerdeCambodiaCameroonCanadaCaribbeanCentral AmericaChileChinaColombiaCongoCosta RicaCroatiaCubaCzechoslovakiaDenmarkDominicaDominican RepublicEastern AfricaEastern AsiaEastern EuropeEcuadorEgyptEl SalvadorEnglandEritreaEthiopiaEuropeFijiFranceGermanyGhanaGreeceGrenadaGuatemalaGuyanaHaitiHondurasHong KongHungaryIndiaIndonesiaIranIraqIrelandIsraelItalyJamaicaJapanJordanKazakhstanKenyaKoreaKuwaitLaosLatin AmericaLatviaLebanonLiberiaLithuaniaMalaysiaMexicoMicronesiaMiddle AfricaMoldovaMoroccoNepalNetherlandsNicaraguaNigeriaNorth AmericaNorth MacedoniaNorthern AfricaNorthern EuropeNorwayOceaniaPakistanPanamaPeruPhilippinesPolandPortugalRomaniaRussiaSaudi ArabiaScotlandSenegalSerbiaSierra LeoneSingaporeSomaliaSouth AfricaSouth AmericaSouth Central AsiaSouth Eastern AsiaSouthern EuropeSpainSri LankaSt. Vincent and the GrenadinesSudanSwedenSwitzerlandSyriaTaiwanThailandTrinidad and TobagoTurkeyUgandaUkraineUruguayUzbekistanVenezuelaVietnamWest IndiesWestern AfricaWestern AsiaWestern EuropeYemenZaireZimbabweAzores
No Schooling Completed
Income
Poverty
Unemployment
Labor Participation
Family Structure
Vehicle Availability
Education Level
Disability

No Schooling Completed Comparison

Bhutanese

Hondurans

Exceptional
Tragic
1.8%
NO SCHOOLING COMPLETED
98.4/ 100
METRIC RATING
96th/ 347
METRIC RANK
3.1%
NO SCHOOLING COMPLETED
0.0/ 100
METRIC RATING
313th/ 347
METRIC RANK

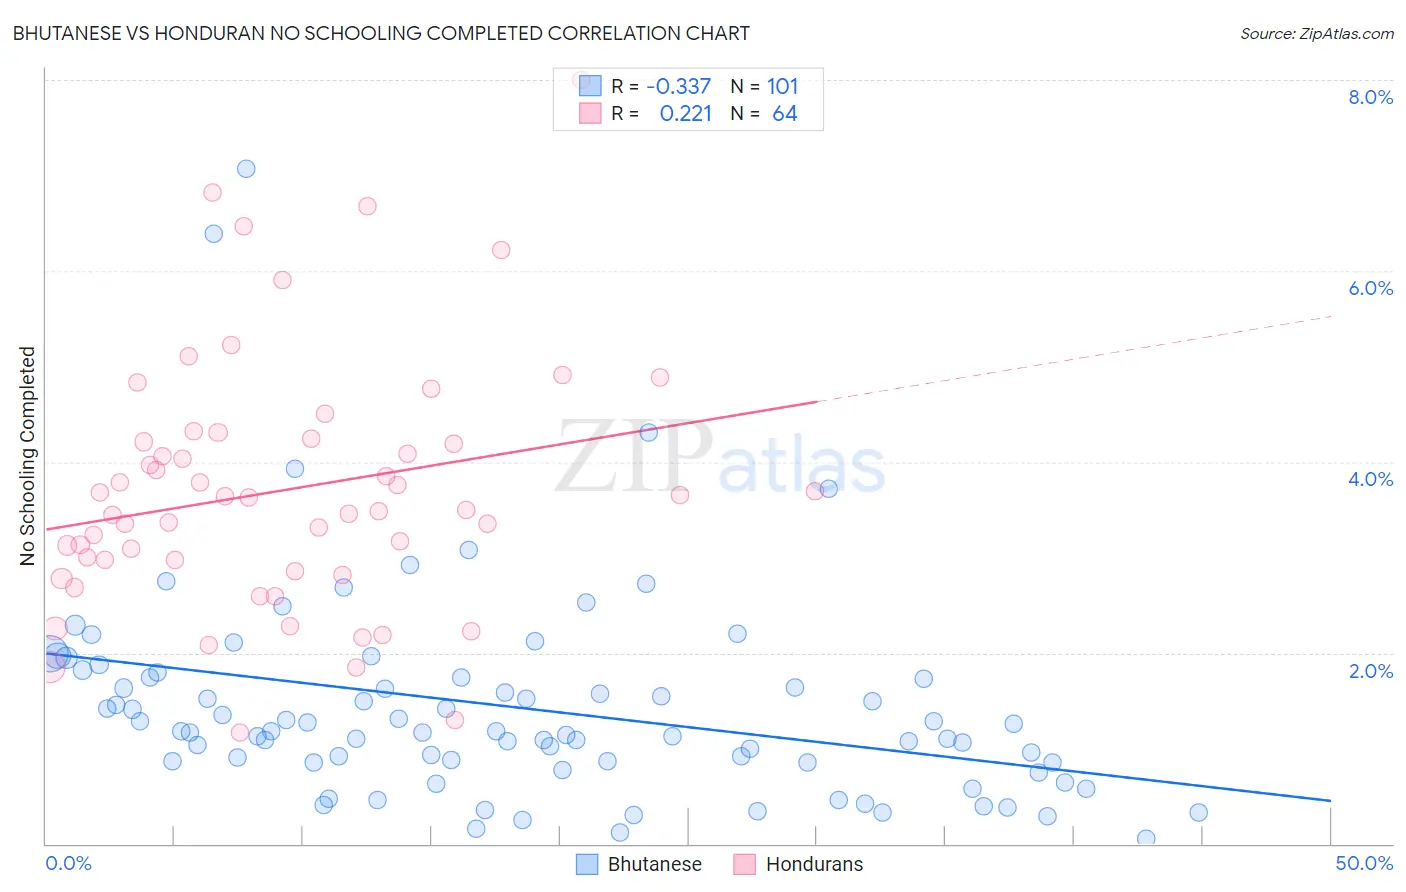
Bhutanese vs Honduran No Schooling Completed Correlation Chart

The statistical analysis conducted on geographies consisting of 448,858,455 people shows a mild negative correlation between the proportion of Bhutanese and percentage of population with no schooling in the United States with a correlation coefficient (R) of -0.337 and weighted average of 1.8%. Similarly, the statistical analysis conducted on geographies consisting of 355,822,203 people shows a weak positive correlation between the proportion of Hondurans and percentage of population with no schooling in the United States with a correlation coefficient (R) of 0.221 and weighted average of 3.1%, a difference of 70.1%.
Bhutanese vs Honduran No Schooling Completed

No Schooling Completed Correlation Summary

MeasurementBhutaneseHonduran
Minimum0.048%1.2%
Maximum7.1%8.0%
Range7.0%6.8%
Mean1.4%3.7%
Median1.2%3.6%
Interquartile 25% (IQ1)0.85%2.9%
Interquartile 75% (IQ3)1.7%4.2%
Interquartile Range (IQR)0.89%1.3%
Standard Deviation (Sample)1.1%1.3%
Standard Deviation (Population)1.1%1.3%

Similar Demographics by No Schooling Completed

Demographics Similar to Bhutanese by No Schooling Completed

In terms of no schooling completed, the demographic groups most similar to Bhutanese are Immigrants from Ireland (1.8%, a difference of 0.18%), Puget Sound Salish (1.8%, a difference of 0.23%), Nonimmigrants (1.8%, a difference of 0.24%), Iranian (1.8%, a difference of 0.46%), and Choctaw (1.8%, a difference of 0.65%).
DemographicsRating | RankNo Schooling Completed
South Africans
99.1
/100
|
#89
Exceptional
1.8%
Sioux
99.0
/100
|
#90
Exceptional
1.8%
Immigrants | Germany
99.0
/100
|
#91
Exceptional
1.8%
Romanians
98.8
/100
|
#92
Exceptional
1.8%
Turks
98.7
/100
|
#93
Exceptional
1.8%
Immigrants | Nonimmigrants
98.5
/100
|
#94
Exceptional
1.8%
Puget Sound Salish
98.5
/100
|
#95
Exceptional
1.8%
Bhutanese
98.4
/100
|
#96
Exceptional
1.8%
Immigrants | Ireland
98.4
/100
|
#97
Exceptional
1.8%
Iranians
98.2
/100
|
#98
Exceptional
1.8%
Choctaw
98.1
/100
|
#99
Exceptional
1.8%
Immigrants | Singapore
98.0
/100
|
#100
Exceptional
1.8%
Immigrants | Czechoslovakia
97.9
/100
|
#101
Exceptional
1.8%
Immigrants | Switzerland
97.9
/100
|
#102
Exceptional
1.8%
Basques
97.9
/100
|
#103
Exceptional
1.8%

Demographics Similar to Hondurans by No Schooling Completed

In terms of no schooling completed, the demographic groups most similar to Hondurans are Immigrants from Belize (3.1%, a difference of 0.090%), Immigrants from Nicaragua (3.1%, a difference of 0.33%), Sri Lankan (3.0%, a difference of 0.51%), Immigrants from Ecuador (3.1%, a difference of 0.69%), and Immigrants from the Azores (3.0%, a difference of 0.79%).
DemographicsRating | RankNo Schooling Completed
Belizeans
0.0
/100
|
#306
Tragic
3.0%
Immigrants | Haiti
0.0
/100
|
#307
Tragic
3.0%
Immigrants | Somalia
0.0
/100
|
#308
Tragic
3.0%
Hispanics or Latinos
0.0
/100
|
#309
Tragic
3.0%
Guyanese
0.0
/100
|
#310
Tragic
3.0%
Immigrants | Azores
0.0
/100
|
#311
Tragic
3.0%
Sri Lankans
0.0
/100
|
#312
Tragic
3.0%
Hondurans
0.0
/100
|
#313
Tragic
3.1%
Immigrants | Belize
0.0
/100
|
#314
Tragic
3.1%
Immigrants | Nicaragua
0.0
/100
|
#315
Tragic
3.1%
Immigrants | Ecuador
0.0
/100
|
#316
Tragic
3.1%
Cape Verdeans
0.0
/100
|
#317
Tragic
3.1%
Immigrants | Guyana
0.0
/100
|
#318
Tragic
3.1%
Immigrants | Burma/Myanmar
0.0
/100
|
#319
Tragic
3.1%
Immigrants | Bangladesh
0.0
/100
|
#320
Tragic
3.1%