Bhutanese vs Costa Rican 5th Grade

COMPARE

Bhutanese
Race
Ancestry
AfghanAfricanAlaska NativeAlaskan AthabascanAlbanianAleutAlsatianAmericanApacheArabArapahoArgentineanArmenianAssyrian/Chaldean/SyriacAustralianAustrianBahamianBangladeshiBarbadianBasqueBelgianBelizeanBermudanBhutaneseBlackfeetBolivianBrazilianBritishBritish West IndianBulgarianBurmeseCajunCambodianCanadianCape VerdeanCarpatho RusynCelticCentral AmericanCentral American IndianCherokeeCheyenneChickasawChileanChineseChippewaChoctawColombianColvilleComancheCreeCreekCroatianCrowCubanCypriotCzechCzechoslovakianDanishDelawareDominicanDutchDutch West IndianEastern EuropeanEcuadorianEgyptianEnglishEstonianEthiopianEuropeanFijianFilipinoFinnishFrenchFrench American IndianFrench CanadianGermanGerman RussianGhanaianGreekGuamanian/ChamorroGuatemalanGuyaneseHaitianHmongHonduranHopiHoumaHungarianIcelanderIndian (Asian)IndonesianInupiatIranianIraqiIrishIroquoisIsraeliItalianJamaicanJapaneseJordanianKenyanKiowaKoreanLaotianLatvianLebaneseLiberianLithuanianLumbeeLuxembourgerMacedonianMalaysianMalteseMarshalleseMenomineeMexicanMexican American IndianMongolianMoroccanNative HawaiianNavajoNepaleseNew ZealanderNicaraguanNigerianNorthern EuropeanNorwegianOkinawanOsageOttawaPaiutePakistaniPalestinianPanamanianParaguayanPennsylvania GermanPeruvianPimaPolishPortuguesePotawatomiPuebloPuerto RicanPuget Sound SalishRomanianRussianSalvadoranSamoanScandinavianScotch-IrishScottishSeminoleSenegaleseSerbianShoshoneSierra LeoneanSiouxSlavicSlovakSloveneSomaliSouth AfricanSouth AmericanSouth American IndianSoviet UnionSpaniardSpanishSpanish AmericanSpanish American IndianSri LankanSubsaharan AfricanSudaneseSwedishSwissSyrianTaiwaneseThaiTlingit-HaidaTohono O'OdhamTonganTrinidadian and TobagonianTsimshianTurkishU.S. Virgin IslanderUgandanUkrainianUruguayanUteVenezuelanVietnameseWelshWest IndianYakamaYaquiYugoslavianYumanYup'ikZimbabwean
Immigration
NonimmigrantsImmigrantsAfghanistanAfricaAlbaniaArgentinaArmeniaAsiaAustraliaAustriaBahamasBangladeshBarbadosBelarusBelgiumBelizeBoliviaBosnia and HerzegovinaBrazilBulgariaBurma/MyanmarCabo VerdeCambodiaCameroonCanadaCaribbeanCentral AmericaChileChinaColombiaCongoCosta RicaCroatiaCubaCzechoslovakiaDenmarkDominicaDominican RepublicEastern AfricaEastern AsiaEastern EuropeEcuadorEgyptEl SalvadorEnglandEritreaEthiopiaEuropeFijiFranceGermanyGhanaGreeceGrenadaGuatemalaGuyanaHaitiHondurasHong KongHungaryIndiaIndonesiaIranIraqIrelandIsraelItalyJamaicaJapanJordanKazakhstanKenyaKoreaKuwaitLaosLatin AmericaLatviaLebanonLiberiaLithuaniaMalaysiaMexicoMicronesiaMiddle AfricaMoldovaMoroccoNepalNetherlandsNicaraguaNigeriaNorth AmericaNorth MacedoniaNorthern AfricaNorthern EuropeNorwayOceaniaPakistanPanamaPeruPhilippinesPolandPortugalRomaniaRussiaSaudi ArabiaScotlandSenegalSerbiaSierra LeoneSingaporeSomaliaSouth AfricaSouth AmericaSouth Central AsiaSouth Eastern AsiaSouthern EuropeSpainSri LankaSt. Vincent and the GrenadinesSudanSwedenSwitzerlandSyriaTaiwanThailandTrinidad and TobagoTurkeyUgandaUkraineUruguayUzbekistanVenezuelaVietnamWest IndiesWestern AfricaWestern AsiaWestern EuropeYemenZaireZimbabweAzores
Costa Rican
Race
Ancestry
AfghanAfricanAlaska NativeAlaskan AthabascanAlbanianAleutAlsatianAmericanApacheArabArapahoArgentineanArmenianAssyrian/Chaldean/SyriacAustralianAustrianBahamianBangladeshiBarbadianBasqueBelgianBelizeanBermudanBlackfeetBolivianBrazilianBritishBritish West IndianBulgarianBurmeseCajunCambodianCanadianCape VerdeanCarpatho RusynCelticCentral AmericanCentral American IndianCherokeeCheyenneChickasawChileanChineseChippewaChoctawColombianColvilleComancheCosta RicanCreeCreekCroatianCrowCubanCypriotCzechCzechoslovakianDanishDelawareDominicanDutchDutch West IndianEastern EuropeanEcuadorianEgyptianEnglishEstonianEthiopianEuropeanFijianFilipinoFinnishFrenchFrench American IndianFrench CanadianGermanGerman RussianGhanaianGreekGuamanian/ChamorroGuatemalanGuyaneseHaitianHmongHonduranHopiHoumaHungarianIcelanderIndian (Asian)IndonesianInupiatIranianIraqiIrishIroquoisIsraeliItalianJamaicanJapaneseJordanianKenyanKiowaKoreanLaotianLatvianLebaneseLiberianLithuanianLumbeeLuxembourgerMacedonianMalaysianMalteseMarshalleseMenomineeMexicanMexican American IndianMongolianMoroccanNative HawaiianNavajoNepaleseNew ZealanderNicaraguanNigerianNorthern EuropeanNorwegianOkinawanOsageOttawaPaiutePakistaniPalestinianPanamanianParaguayanPennsylvania GermanPeruvianPimaPolishPortuguesePotawatomiPuebloPuerto RicanPuget Sound SalishRomanianRussianSalvadoranSamoanScandinavianScotch-IrishScottishSeminoleSenegaleseSerbianShoshoneSierra LeoneanSiouxSlavicSlovakSloveneSomaliSouth AfricanSouth AmericanSouth American IndianSoviet UnionSpaniardSpanishSpanish AmericanSpanish American IndianSri LankanSubsaharan AfricanSudaneseSwedishSwissSyrianTaiwaneseThaiTlingit-HaidaTohono O'OdhamTonganTrinidadian and TobagonianTsimshianTurkishU.S. Virgin IslanderUgandanUkrainianUruguayanUteVenezuelanVietnameseWelshWest IndianYakamaYaquiYugoslavianYumanYup'ikZimbabwean
Immigration
NonimmigrantsImmigrantsAfghanistanAfricaAlbaniaArgentinaArmeniaAsiaAustraliaAustriaBahamasBangladeshBarbadosBelarusBelgiumBelizeBoliviaBosnia and HerzegovinaBrazilBulgariaBurma/MyanmarCabo VerdeCambodiaCameroonCanadaCaribbeanCentral AmericaChileChinaColombiaCongoCosta RicaCroatiaCubaCzechoslovakiaDenmarkDominicaDominican RepublicEastern AfricaEastern AsiaEastern EuropeEcuadorEgyptEl SalvadorEnglandEritreaEthiopiaEuropeFijiFranceGermanyGhanaGreeceGrenadaGuatemalaGuyanaHaitiHondurasHong KongHungaryIndiaIndonesiaIranIraqIrelandIsraelItalyJamaicaJapanJordanKazakhstanKenyaKoreaKuwaitLaosLatin AmericaLatviaLebanonLiberiaLithuaniaMalaysiaMexicoMicronesiaMiddle AfricaMoldovaMoroccoNepalNetherlandsNicaraguaNigeriaNorth AmericaNorth MacedoniaNorthern AfricaNorthern EuropeNorwayOceaniaPakistanPanamaPeruPhilippinesPolandPortugalRomaniaRussiaSaudi ArabiaScotlandSenegalSerbiaSierra LeoneSingaporeSomaliaSouth AfricaSouth AmericaSouth Central AsiaSouth Eastern AsiaSouthern EuropeSpainSri LankaSt. Vincent and the GrenadinesSudanSwedenSwitzerlandSyriaTaiwanThailandTrinidad and TobagoTurkeyUgandaUkraineUruguayUzbekistanVenezuelaVietnamWest IndiesWestern AfricaWestern AsiaWestern EuropeYemenZaireZimbabweAzores
5th Grade
Income
Poverty
Unemployment
Labor Participation
Family Structure
Vehicle Availability
Education Level
Disability

5th Grade Comparison

Bhutanese

Costa Ricans

Exceptional
Tragic
97.7%
5TH GRADE
97.6/ 100
METRIC RATING
105th/ 347
METRIC RANK
97.1%
5TH GRADE
7.7/ 100
METRIC RATING
214th/ 347
METRIC RANK

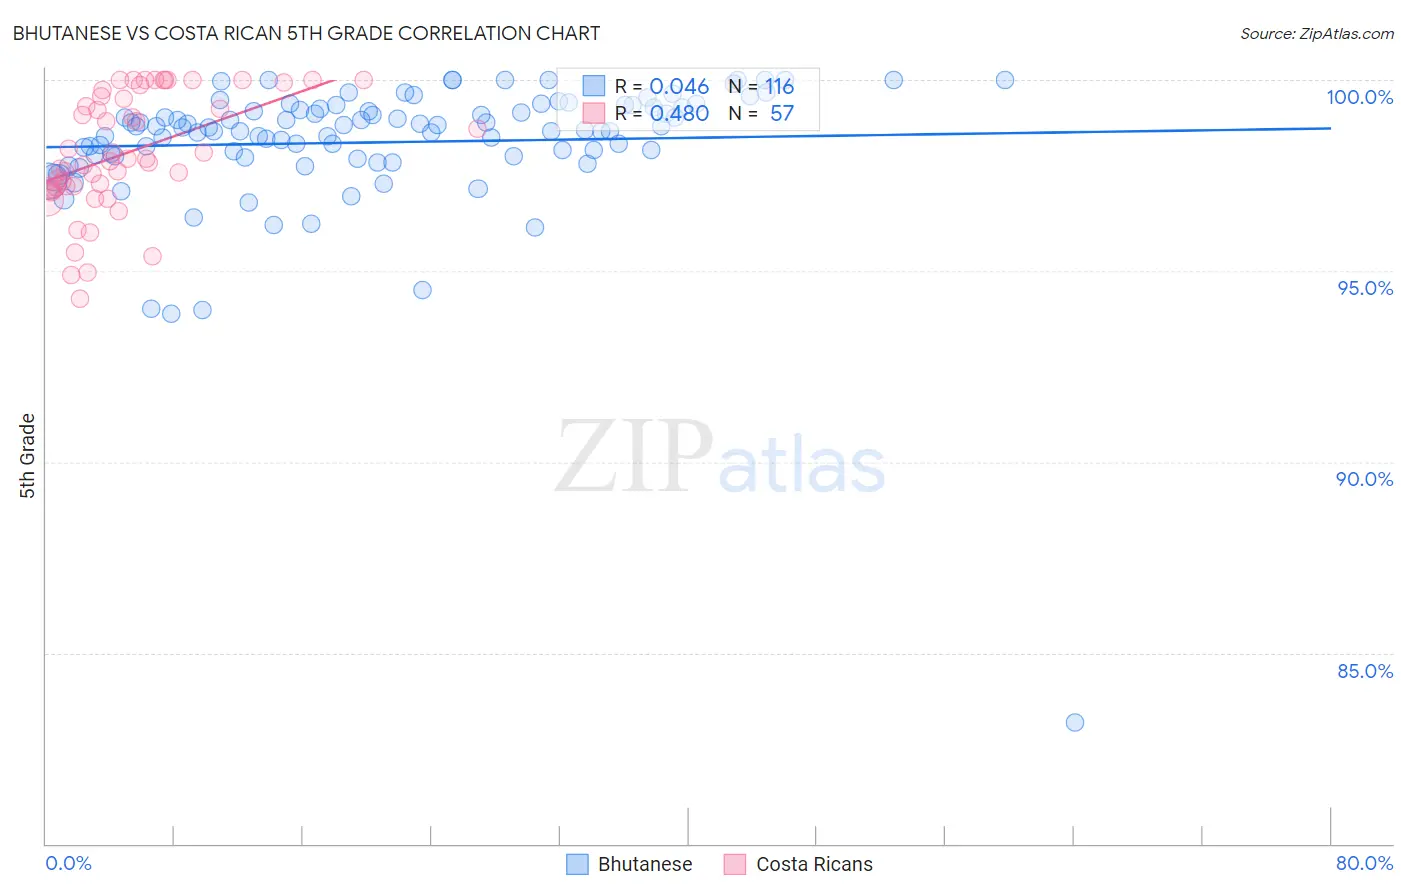
Bhutanese vs Costa Rican 5th Grade Correlation Chart

The statistical analysis conducted on geographies consisting of 455,591,134 people shows no correlation between the proportion of Bhutanese and percentage of population with at least 5th grade education in the United States with a correlation coefficient (R) of 0.046 and weighted average of 97.7%. Similarly, the statistical analysis conducted on geographies consisting of 253,599,979 people shows a moderate positive correlation between the proportion of Costa Ricans and percentage of population with at least 5th grade education in the United States with a correlation coefficient (R) of 0.480 and weighted average of 97.1%, a difference of 0.64%.
Bhutanese vs Costa Rican 5th Grade

5th Grade Correlation Summary

MeasurementBhutaneseCosta Rican
Minimum83.2%94.3%
Maximum100.0%100.0%
Range16.8%5.7%
Mean98.4%98.1%
Median98.7%97.9%
Interquartile 25% (IQ1)98.0%97.2%
Interquartile 75% (IQ3)99.3%99.7%
Interquartile Range (IQR)1.3%2.5%
Standard Deviation (Sample)1.9%1.5%
Standard Deviation (Population)1.9%1.5%

Similar Demographics by 5th Grade

Demographics Similar to Bhutanese by 5th Grade

In terms of 5th grade, the demographic groups most similar to Bhutanese are Immigrants from Czechoslovakia (97.7%, a difference of 0.0%), Immigrants from Singapore (97.7%, a difference of 0.0%), German Russian (97.7%, a difference of 0.010%), Nonimmigrants (97.7%, a difference of 0.010%), and Choctaw (97.7%, a difference of 0.020%).
DemographicsRating | Rank5th Grade
Yugoslavians
98.3
/100
|
#98
Exceptional
97.7%
Turks
98.3
/100
|
#99
Exceptional
97.7%
Puget Sound Salish
98.3
/100
|
#100
Exceptional
97.7%
South Africans
98.3
/100
|
#101
Exceptional
97.7%
Choctaw
98.0
/100
|
#102
Exceptional
97.7%
Cheyenne
97.9
/100
|
#103
Exceptional
97.7%
German Russians
97.8
/100
|
#104
Exceptional
97.7%
Bhutanese
97.6
/100
|
#105
Exceptional
97.7%
Immigrants | Czechoslovakia
97.5
/100
|
#106
Exceptional
97.7%
Immigrants | Singapore
97.5
/100
|
#107
Exceptional
97.7%
Immigrants | Nonimmigrants
97.3
/100
|
#108
Exceptional
97.7%
Immigrants | Latvia
97.1
/100
|
#109
Exceptional
97.7%
Thais
96.9
/100
|
#110
Exceptional
97.7%
Menominee
96.3
/100
|
#111
Exceptional
97.7%
Immigrants | Switzerland
96.0
/100
|
#112
Exceptional
97.7%

Demographics Similar to Costa Ricans by 5th Grade

In terms of 5th grade, the demographic groups most similar to Costa Ricans are Portuguese (97.1%, a difference of 0.0%), Immigrants from Morocco (97.1%, a difference of 0.0%), Samoan (97.1%, a difference of 0.010%), Immigrants from Iraq (97.1%, a difference of 0.010%), and Sudanese (97.1%, a difference of 0.010%).
DemographicsRating | Rank5th Grade
Iraqis
10.9
/100
|
#207
Poor
97.1%
Laotians
10.8
/100
|
#208
Poor
97.1%
Immigrants | Nepal
10.3
/100
|
#209
Poor
97.1%
Immigrants | Oceania
10.0
/100
|
#210
Poor
97.1%
Samoans
8.5
/100
|
#211
Tragic
97.1%
Immigrants | Iraq
8.3
/100
|
#212
Tragic
97.1%
Portuguese
7.8
/100
|
#213
Tragic
97.1%
Costa Ricans
7.7
/100
|
#214
Tragic
97.1%
Immigrants | Morocco
7.5
/100
|
#215
Tragic
97.1%
Sudanese
7.0
/100
|
#216
Tragic
97.1%
Immigrants | Lebanon
6.8
/100
|
#217
Tragic
97.1%
Immigrants | Sudan
6.5
/100
|
#218
Tragic
97.1%
Immigrants | Syria
6.4
/100
|
#219
Tragic
97.1%
Immigrants | Southern Europe
6.3
/100
|
#220
Tragic
97.1%
Sierra Leoneans
6.0
/100
|
#221
Tragic
97.1%