Bermudan vs Cajun Kindergarten
COMPARE
Bermudan
Cajun
Kindergarten
Kindergarten Comparison
Bermudans
Cajuns
98.0%
KINDERGARTEN
54.0/ 100
METRIC RATING
170th/ 347
METRIC RANK
98.3%
KINDERGARTEN
99.4/ 100
METRIC RATING
73rd/ 347
METRIC RANK
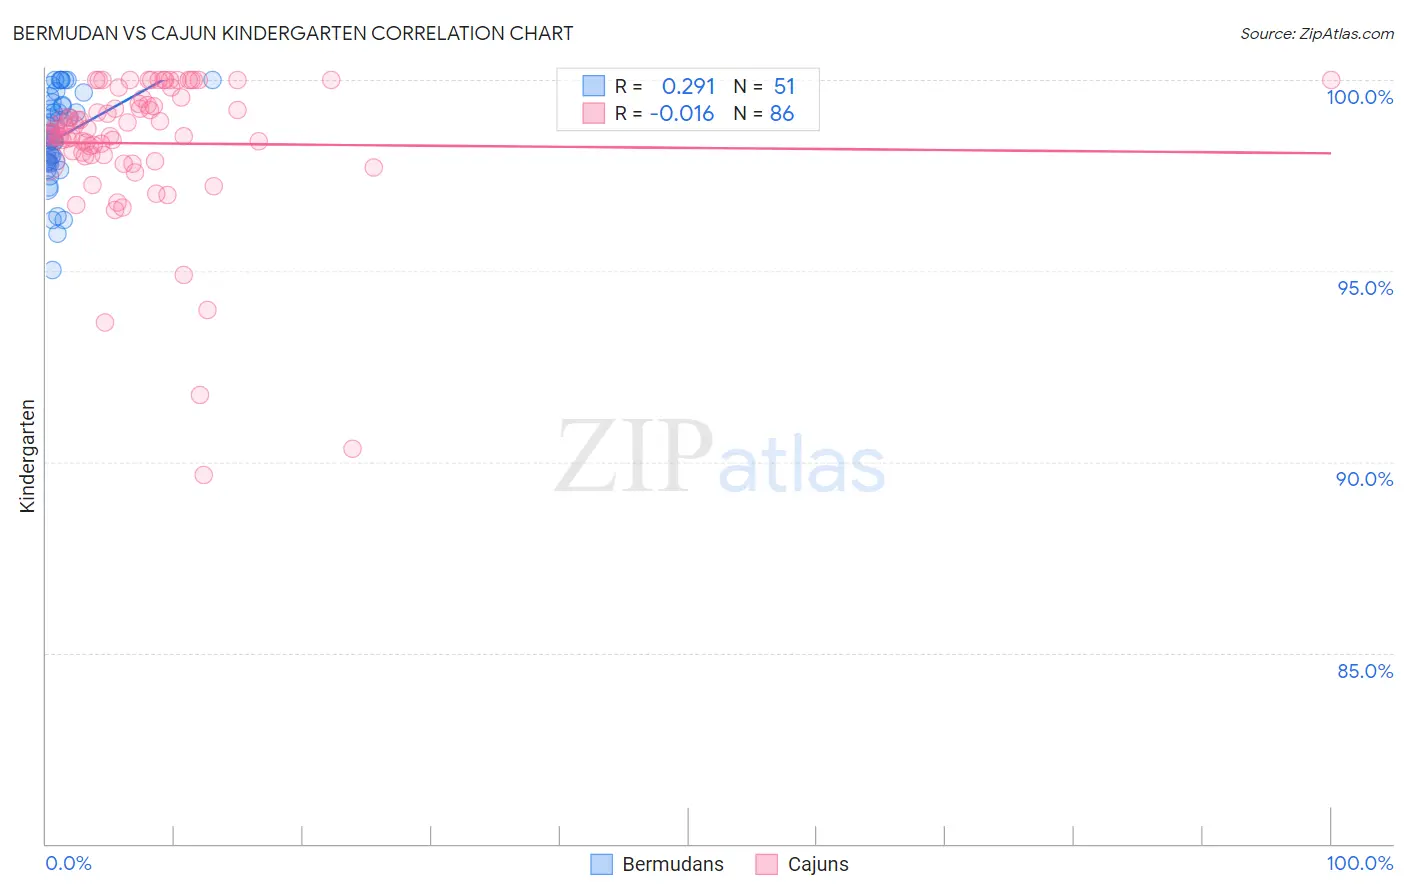
Bermudan vs Cajun Kindergarten Correlation Chart
The statistical analysis conducted on geographies consisting of 55,721,975 people shows a weak positive correlation between the proportion of Bermudans and percentage of population with at least kindergarten education in the United States with a correlation coefficient (R) of 0.291 and weighted average of 98.0%. Similarly, the statistical analysis conducted on geographies consisting of 149,712,957 people shows no correlation between the proportion of Cajuns and percentage of population with at least kindergarten education in the United States with a correlation coefficient (R) of -0.016 and weighted average of 98.3%, a difference of 0.38%.
Kindergarten Correlation Summary
| Measurement | Bermudan | Cajun |
| Minimum | 95.0% | 89.7% |
| Maximum | 100.0% | 100.0% |
| Range | 5.0% | 10.3% |
| Mean | 98.5% | 98.3% |
| Median | 98.5% | 98.7% |
| Interquartile 25% (IQ1) | 97.9% | 98.0% |
| Interquartile 75% (IQ3) | 99.3% | 99.5% |
| Interquartile Range (IQR) | 1.5% | 1.5% |
| Standard Deviation (Sample) | 1.2% | 1.9% |
| Standard Deviation (Population) | 1.2% | 1.9% |
Similar Demographics by Kindergarten
Demographics Similar to Bermudans by Kindergarten
In terms of kindergarten, the demographic groups most similar to Bermudans are Immigrants from Spain (98.0%, a difference of 0.0%), Navajo (98.0%, a difference of 0.0%), Immigrants from Korea (98.0%, a difference of 0.0%), Immigrants from Jordan (98.0%, a difference of 0.0%), and Spanish American (98.0%, a difference of 0.010%).
| Demographics | Rating | Rank | Kindergarten |
| Spanish Americans | 57.8 /100 | #163 | Average 98.0% |
| Immigrants | Micronesia | 57.7 /100 | #164 | Average 98.0% |
| Ugandans | 56.9 /100 | #165 | Average 98.0% |
| Chileans | 56.3 /100 | #166 | Average 98.0% |
| Immigrants | Spain | 54.6 /100 | #167 | Average 98.0% |
| Navajo | 54.4 /100 | #168 | Average 98.0% |
| Immigrants | Korea | 54.1 /100 | #169 | Average 98.0% |
| Bermudans | 54.0 /100 | #170 | Average 98.0% |
| Immigrants | Jordan | 54.0 /100 | #171 | Average 98.0% |
| Natives/Alaskans | 51.0 /100 | #172 | Average 98.0% |
| Kenyans | 51.0 /100 | #173 | Average 98.0% |
| Immigrants | Brazil | 50.0 /100 | #174 | Average 98.0% |
| Immigrants | Sri Lanka | 49.6 /100 | #175 | Average 97.9% |
| Albanians | 48.5 /100 | #176 | Average 97.9% |
| Immigrants | Venezuela | 47.9 /100 | #177 | Average 97.9% |
Demographics Similar to Cajuns by Kindergarten
In terms of kindergarten, the demographic groups most similar to Cajuns are Immigrants from Netherlands (98.3%, a difference of 0.010%), Cherokee (98.3%, a difference of 0.010%), Immigrants from England (98.3%, a difference of 0.010%), Delaware (98.3%, a difference of 0.020%), and Shoshone (98.3%, a difference of 0.020%).
| Demographics | Rating | Rank | Kindergarten |
| Cheyenne | 99.6 /100 | #66 | Exceptional 98.4% |
| Canadians | 99.6 /100 | #67 | Exceptional 98.4% |
| Immigrants | Northern Europe | 99.6 /100 | #68 | Exceptional 98.4% |
| Immigrants | Austria | 99.6 /100 | #69 | Exceptional 98.4% |
| Russians | 99.6 /100 | #70 | Exceptional 98.4% |
| Chickasaw | 99.6 /100 | #71 | Exceptional 98.4% |
| Serbians | 99.6 /100 | #72 | Exceptional 98.4% |
| Cajuns | 99.4 /100 | #73 | Exceptional 98.3% |
| Immigrants | Netherlands | 99.3 /100 | #74 | Exceptional 98.3% |
| Cherokee | 99.3 /100 | #75 | Exceptional 98.3% |
| Immigrants | England | 99.3 /100 | #76 | Exceptional 98.3% |
| Delaware | 99.3 /100 | #77 | Exceptional 98.3% |
| Shoshone | 99.2 /100 | #78 | Exceptional 98.3% |
| Immigrants | Belgium | 99.2 /100 | #79 | Exceptional 98.3% |
| Immigrants | Lithuania | 99.2 /100 | #80 | Exceptional 98.3% |