Belgian vs Immigrants from Bahamas Doctorate Degree
COMPARE
Belgian
Immigrants from Bahamas
Doctorate Degree
Doctorate Degree Comparison
Belgians
Immigrants from Bahamas
1.8%
DOCTORATE DEGREE
50.3/ 100
METRIC RATING
172nd/ 347
METRIC RANK
1.5%
DOCTORATE DEGREE
0.7/ 100
METRIC RATING
263rd/ 347
METRIC RANK
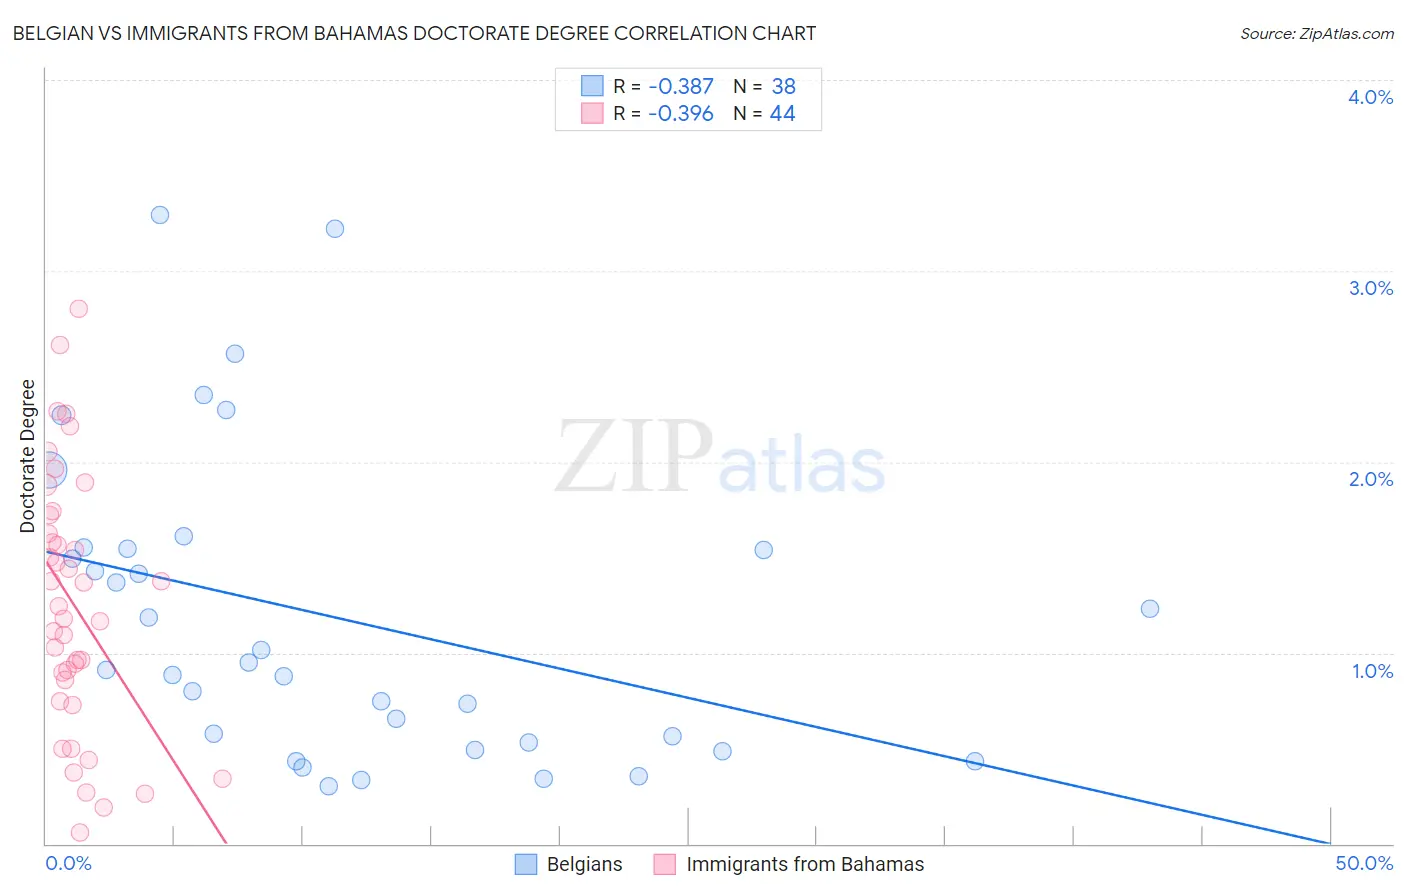
Belgian vs Immigrants from Bahamas Doctorate Degree Correlation Chart
The statistical analysis conducted on geographies consisting of 351,946,706 people shows a mild negative correlation between the proportion of Belgians and percentage of population with at least doctorate degree education in the United States with a correlation coefficient (R) of -0.387 and weighted average of 1.8%. Similarly, the statistical analysis conducted on geographies consisting of 104,472,552 people shows a mild negative correlation between the proportion of Immigrants from Bahamas and percentage of population with at least doctorate degree education in the United States with a correlation coefficient (R) of -0.396 and weighted average of 1.5%, a difference of 22.1%.
Doctorate Degree Correlation Summary
| Measurement | Belgian | Immigrants from Bahamas |
| Minimum | 0.30% | 0.056% |
| Maximum | 3.3% | 2.8% |
| Range | 3.0% | 2.7% |
| Mean | 1.2% | 1.2% |
| Median | 0.93% | 1.2% |
| Interquartile 25% (IQ1) | 0.53% | 0.80% |
| Interquartile 75% (IQ3) | 1.5% | 1.7% |
| Interquartile Range (IQR) | 1.0% | 0.87% |
| Standard Deviation (Sample) | 0.80% | 0.67% |
| Standard Deviation (Population) | 0.79% | 0.66% |
Similar Demographics by Doctorate Degree
Demographics Similar to Belgians by Doctorate Degree
In terms of doctorate degree, the demographic groups most similar to Belgians are Norwegian (1.8%, a difference of 0.040%), Immigrants from Bangladesh (1.8%, a difference of 0.040%), Immigrants from Thailand (1.8%, a difference of 0.12%), Spanish (1.8%, a difference of 0.14%), and Iraqi (1.8%, a difference of 0.15%).
| Demographics | Rating | Rank | Doctorate Degree |
| Scotch-Irish | 63.6 /100 | #165 | Good 1.9% |
| Spaniards | 63.5 /100 | #166 | Good 1.9% |
| Macedonians | 60.9 /100 | #167 | Good 1.9% |
| Sri Lankans | 60.3 /100 | #168 | Good 1.9% |
| Vietnamese | 54.8 /100 | #169 | Average 1.9% |
| Costa Ricans | 53.3 /100 | #170 | Average 1.8% |
| Bermudans | 52.1 /100 | #171 | Average 1.8% |
| Belgians | 50.3 /100 | #172 | Average 1.8% |
| Norwegians | 50.0 /100 | #173 | Average 1.8% |
| Immigrants | Bangladesh | 50.0 /100 | #174 | Average 1.8% |
| Immigrants | Thailand | 49.4 /100 | #175 | Average 1.8% |
| Spanish | 49.3 /100 | #176 | Average 1.8% |
| Iraqis | 49.2 /100 | #177 | Average 1.8% |
| French | 48.8 /100 | #178 | Average 1.8% |
| Ghanaians | 48.3 /100 | #179 | Average 1.8% |
Demographics Similar to Immigrants from Bahamas by Doctorate Degree
In terms of doctorate degree, the demographic groups most similar to Immigrants from Bahamas are Chickasaw (1.5%, a difference of 0.17%), Blackfeet (1.5%, a difference of 0.18%), Immigrants from Portugal (1.5%, a difference of 0.32%), Nicaraguan (1.5%, a difference of 0.47%), and Japanese (1.5%, a difference of 0.79%).
| Demographics | Rating | Rank | Doctorate Degree |
| Central American Indians | 1.0 /100 | #256 | Tragic 1.5% |
| Chippewa | 0.9 /100 | #257 | Tragic 1.5% |
| Immigrants | West Indies | 0.9 /100 | #258 | Tragic 1.5% |
| Liberians | 0.9 /100 | #259 | Tragic 1.5% |
| Japanese | 0.9 /100 | #260 | Tragic 1.5% |
| Immigrants | Portugal | 0.8 /100 | #261 | Tragic 1.5% |
| Chickasaw | 0.7 /100 | #262 | Tragic 1.5% |
| Immigrants | Bahamas | 0.7 /100 | #263 | Tragic 1.5% |
| Blackfeet | 0.7 /100 | #264 | Tragic 1.5% |
| Nicaraguans | 0.6 /100 | #265 | Tragic 1.5% |
| Immigrants | Liberia | 0.5 /100 | #266 | Tragic 1.5% |
| Kiowa | 0.5 /100 | #267 | Tragic 1.5% |
| U.S. Virgin Islanders | 0.5 /100 | #268 | Tragic 1.5% |
| Crow | 0.5 /100 | #269 | Tragic 1.5% |
| Salvadorans | 0.5 /100 | #270 | Tragic 1.5% |