Barbadian vs Yugoslavian 7th Grade
COMPARE
Barbadian
Yugoslavian
7th Grade
7th Grade Comparison
Barbadians
Yugoslavians
95.1%
7TH GRADE
0.1/ 100
METRIC RATING
279th/ 347
METRIC RANK
96.8%
7TH GRADE
99.3/ 100
METRIC RATING
80th/ 347
METRIC RANK
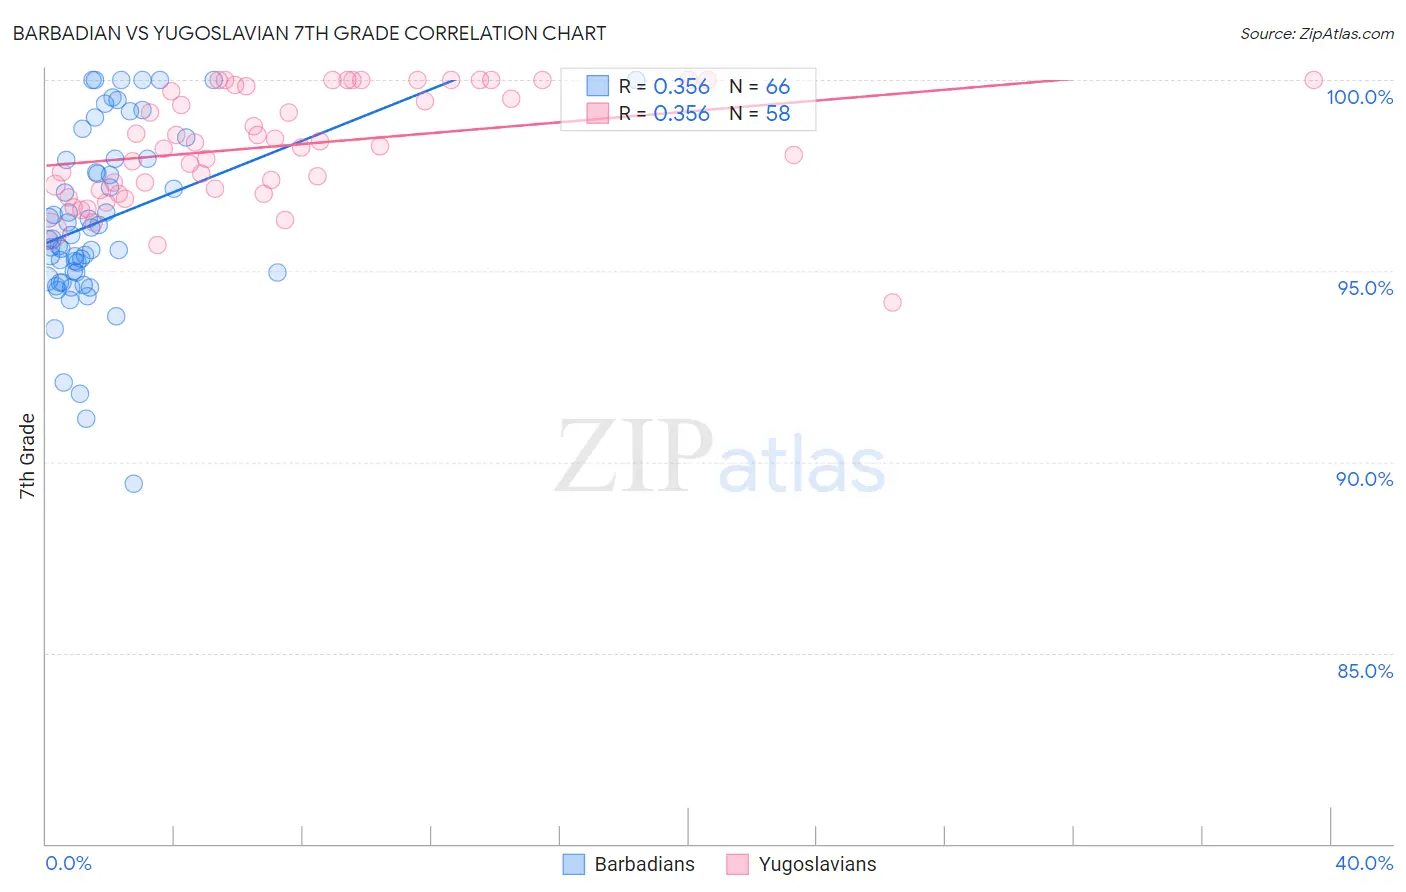
Barbadian vs Yugoslavian 7th Grade Correlation Chart
The statistical analysis conducted on geographies consisting of 141,299,217 people shows a mild positive correlation between the proportion of Barbadians and percentage of population with at least 7th grade education in the United States with a correlation coefficient (R) of 0.356 and weighted average of 95.1%. Similarly, the statistical analysis conducted on geographies consisting of 285,618,157 people shows a mild positive correlation between the proportion of Yugoslavians and percentage of population with at least 7th grade education in the United States with a correlation coefficient (R) of 0.356 and weighted average of 96.8%, a difference of 1.8%.
7th Grade Correlation Summary
| Measurement | Barbadian | Yugoslavian |
| Minimum | 89.4% | 94.2% |
| Maximum | 100.0% | 100.0% |
| Range | 10.6% | 5.8% |
| Mean | 96.3% | 98.3% |
| Median | 95.9% | 98.3% |
| Interquartile 25% (IQ1) | 95.0% | 97.1% |
| Interquartile 75% (IQ3) | 97.9% | 99.9% |
| Interquartile Range (IQR) | 3.0% | 2.7% |
| Standard Deviation (Sample) | 2.3% | 1.4% |
| Standard Deviation (Population) | 2.3% | 1.4% |
Similar Demographics by 7th Grade
Demographics Similar to Barbadians by 7th Grade
In terms of 7th grade, the demographic groups most similar to Barbadians are Immigrants from Trinidad and Tobago (95.1%, a difference of 0.010%), Immigrants from St. Vincent and the Grenadines (95.0%, a difference of 0.030%), Tohono O'odham (95.0%, a difference of 0.030%), Immigrants from Afghanistan (95.1%, a difference of 0.040%), and Immigrants from Bolivia (95.0%, a difference of 0.040%).
| Demographics | Rating | Rank | 7th Grade |
| Peruvians | 0.2 /100 | #272 | Tragic 95.1% |
| Immigrants | Uzbekistan | 0.2 /100 | #273 | Tragic 95.1% |
| Immigrants | Western Africa | 0.2 /100 | #274 | Tragic 95.1% |
| Immigrants | Colombia | 0.2 /100 | #275 | Tragic 95.1% |
| Immigrants | Thailand | 0.2 /100 | #276 | Tragic 95.1% |
| Immigrants | Afghanistan | 0.2 /100 | #277 | Tragic 95.1% |
| Immigrants | Trinidad and Tobago | 0.1 /100 | #278 | Tragic 95.1% |
| Barbadians | 0.1 /100 | #279 | Tragic 95.1% |
| Immigrants | St. Vincent and the Grenadines | 0.1 /100 | #280 | Tragic 95.0% |
| Tohono O'odham | 0.1 /100 | #281 | Tragic 95.0% |
| Immigrants | Bolivia | 0.1 /100 | #282 | Tragic 95.0% |
| Immigrants | Barbados | 0.1 /100 | #283 | Tragic 95.0% |
| Armenians | 0.1 /100 | #284 | Tragic 95.0% |
| Immigrants | Eritrea | 0.1 /100 | #285 | Tragic 94.9% |
| Immigrants | Philippines | 0.0 /100 | #286 | Tragic 94.9% |
Demographics Similar to Yugoslavians by 7th Grade
In terms of 7th grade, the demographic groups most similar to Yugoslavians are Immigrants from Netherlands (96.8%, a difference of 0.0%), Cypriot (96.8%, a difference of 0.0%), Immigrants from Ireland (96.8%, a difference of 0.010%), Cherokee (96.8%, a difference of 0.010%), and Delaware (96.8%, a difference of 0.020%).
| Demographics | Rating | Rank | 7th Grade |
| Arapaho | 99.5 /100 | #73 | Exceptional 96.8% |
| Immigrants | England | 99.5 /100 | #74 | Exceptional 96.8% |
| Zimbabweans | 99.5 /100 | #75 | Exceptional 96.8% |
| Immigrants | Ireland | 99.4 /100 | #76 | Exceptional 96.8% |
| Cherokee | 99.4 /100 | #77 | Exceptional 96.8% |
| Immigrants | Netherlands | 99.3 /100 | #78 | Exceptional 96.8% |
| Cypriots | 99.3 /100 | #79 | Exceptional 96.8% |
| Yugoslavians | 99.3 /100 | #80 | Exceptional 96.8% |
| Delaware | 99.2 /100 | #81 | Exceptional 96.8% |
| Chickasaw | 99.2 /100 | #82 | Exceptional 96.7% |
| Icelanders | 99.1 /100 | #83 | Exceptional 96.7% |
| Romanians | 99.1 /100 | #84 | Exceptional 96.7% |
| Kiowa | 99.1 /100 | #85 | Exceptional 96.7% |
| Turks | 99.1 /100 | #86 | Exceptional 96.7% |
| Immigrants | Belgium | 99.0 /100 | #87 | Exceptional 96.7% |