Barbadian vs Immigrants from Argentina 10th Grade
COMPARE
Barbadian
Immigrants from Argentina
10th Grade
10th Grade Comparison
Barbadians
Immigrants from Argentina
92.2%
10TH GRADE
0.1/ 100
METRIC RATING
278th/ 347
METRIC RANK
93.7%
10TH GRADE
47.1/ 100
METRIC RATING
176th/ 347
METRIC RANK
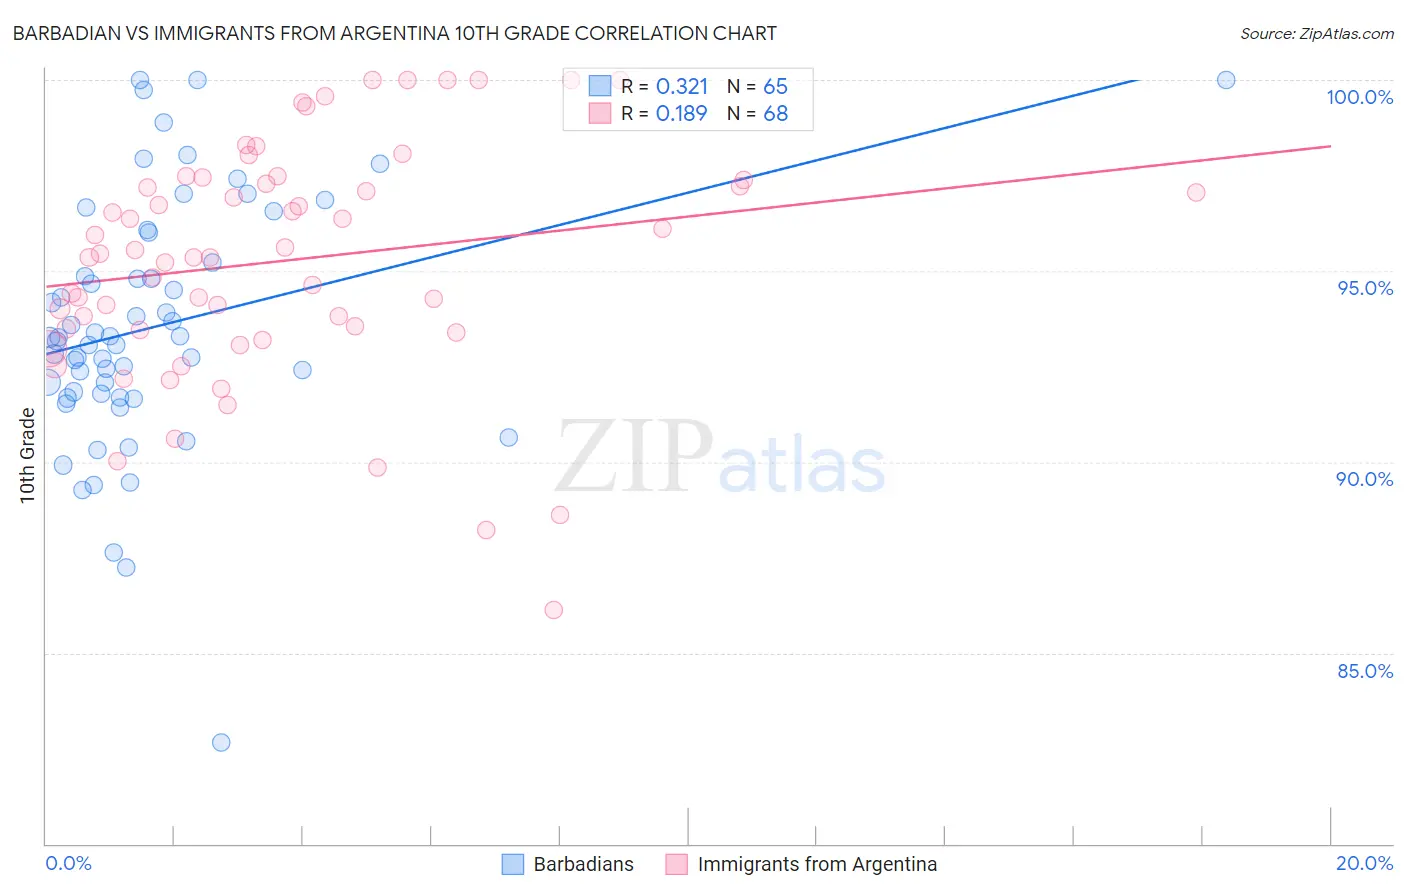
Barbadian vs Immigrants from Argentina 10th Grade Correlation Chart
The statistical analysis conducted on geographies consisting of 141,299,083 people shows a mild positive correlation between the proportion of Barbadians and percentage of population with at least 10th grade education in the United States with a correlation coefficient (R) of 0.321 and weighted average of 92.2%. Similarly, the statistical analysis conducted on geographies consisting of 264,436,618 people shows a poor positive correlation between the proportion of Immigrants from Argentina and percentage of population with at least 10th grade education in the United States with a correlation coefficient (R) of 0.189 and weighted average of 93.7%, a difference of 1.6%.
10th Grade Correlation Summary
| Measurement | Barbadian | Immigrants from Argentina |
| Minimum | 82.6% | 86.1% |
| Maximum | 100.0% | 100.0% |
| Range | 17.4% | 13.9% |
| Mean | 93.5% | 95.3% |
| Median | 93.3% | 95.4% |
| Interquartile 25% (IQ1) | 91.7% | 93.5% |
| Interquartile 75% (IQ3) | 95.6% | 97.3% |
| Interquartile Range (IQR) | 3.9% | 3.9% |
| Standard Deviation (Sample) | 3.3% | 3.1% |
| Standard Deviation (Population) | 3.2% | 3.0% |
Similar Demographics by 10th Grade
Demographics Similar to Barbadians by 10th Grade
In terms of 10th grade, the demographic groups most similar to Barbadians are Native/Alaskan (92.2%, a difference of 0.010%), Navajo (92.3%, a difference of 0.040%), Malaysian (92.2%, a difference of 0.040%), Bangladeshi (92.2%, a difference of 0.040%), and Immigrants from Peru (92.2%, a difference of 0.060%).
| Demographics | Rating | Rank | 10th Grade |
| Immigrants | Eritrea | 0.3 /100 | #271 | Tragic 92.5% |
| Immigrants | Western Africa | 0.3 /100 | #272 | Tragic 92.5% |
| Trinidadians and Tobagonians | 0.2 /100 | #273 | Tragic 92.4% |
| Immigrants | Congo | 0.2 /100 | #274 | Tragic 92.4% |
| West Indians | 0.2 /100 | #275 | Tragic 92.4% |
| Immigrants | Trinidad and Tobago | 0.1 /100 | #276 | Tragic 92.3% |
| Navajo | 0.1 /100 | #277 | Tragic 92.3% |
| Barbadians | 0.1 /100 | #278 | Tragic 92.2% |
| Natives/Alaskans | 0.1 /100 | #279 | Tragic 92.2% |
| Malaysians | 0.1 /100 | #280 | Tragic 92.2% |
| Bangladeshis | 0.1 /100 | #281 | Tragic 92.2% |
| Immigrants | Peru | 0.1 /100 | #282 | Tragic 92.2% |
| Immigrants | St. Vincent and the Grenadines | 0.0 /100 | #283 | Tragic 92.1% |
| Immigrants | Barbados | 0.0 /100 | #284 | Tragic 92.1% |
| Immigrants | South Eastern Asia | 0.0 /100 | #285 | Tragic 92.1% |
Demographics Similar to Immigrants from Argentina by 10th Grade
In terms of 10th grade, the demographic groups most similar to Immigrants from Argentina are Immigrants from Lebanon (93.7%, a difference of 0.0%), Sierra Leonean (93.7%, a difference of 0.010%), Immigrants from Nepal (93.7%, a difference of 0.020%), Paraguayan (93.7%, a difference of 0.020%), and French American Indian (93.7%, a difference of 0.030%).
| Demographics | Rating | Rank | 10th Grade |
| Immigrants | Spain | 55.9 /100 | #169 | Average 93.8% |
| Immigrants | Venezuela | 53.9 /100 | #170 | Average 93.8% |
| Immigrants | Albania | 52.4 /100 | #171 | Average 93.8% |
| French American Indians | 50.9 /100 | #172 | Average 93.7% |
| Spaniards | 50.3 /100 | #173 | Average 93.7% |
| Argentineans | 50.0 /100 | #174 | Average 93.7% |
| Immigrants | Nepal | 49.6 /100 | #175 | Average 93.7% |
| Immigrants | Argentina | 47.1 /100 | #176 | Average 93.7% |
| Immigrants | Lebanon | 47.1 /100 | #177 | Average 93.7% |
| Sierra Leoneans | 46.1 /100 | #178 | Average 93.7% |
| Paraguayans | 45.3 /100 | #179 | Average 93.7% |
| Blackfeet | 42.8 /100 | #180 | Average 93.7% |
| Immigrants | Northern Africa | 41.6 /100 | #181 | Average 93.7% |
| Colville | 38.8 /100 | #182 | Fair 93.6% |
| Guamanians/Chamorros | 37.1 /100 | #183 | Fair 93.6% |