Barbadian vs Choctaw 12th Grade, No Diploma
COMPARE
Barbadian
Choctaw
12th Grade, No Diploma
12th Grade, No Diploma Comparison
Barbadians
Choctaw
89.1%
12TH GRADE, NO DIPLOMA
0.1/ 100
METRIC RATING
273rd/ 347
METRIC RANK
89.8%
12TH GRADE, NO DIPLOMA
0.7/ 100
METRIC RATING
253rd/ 347
METRIC RANK
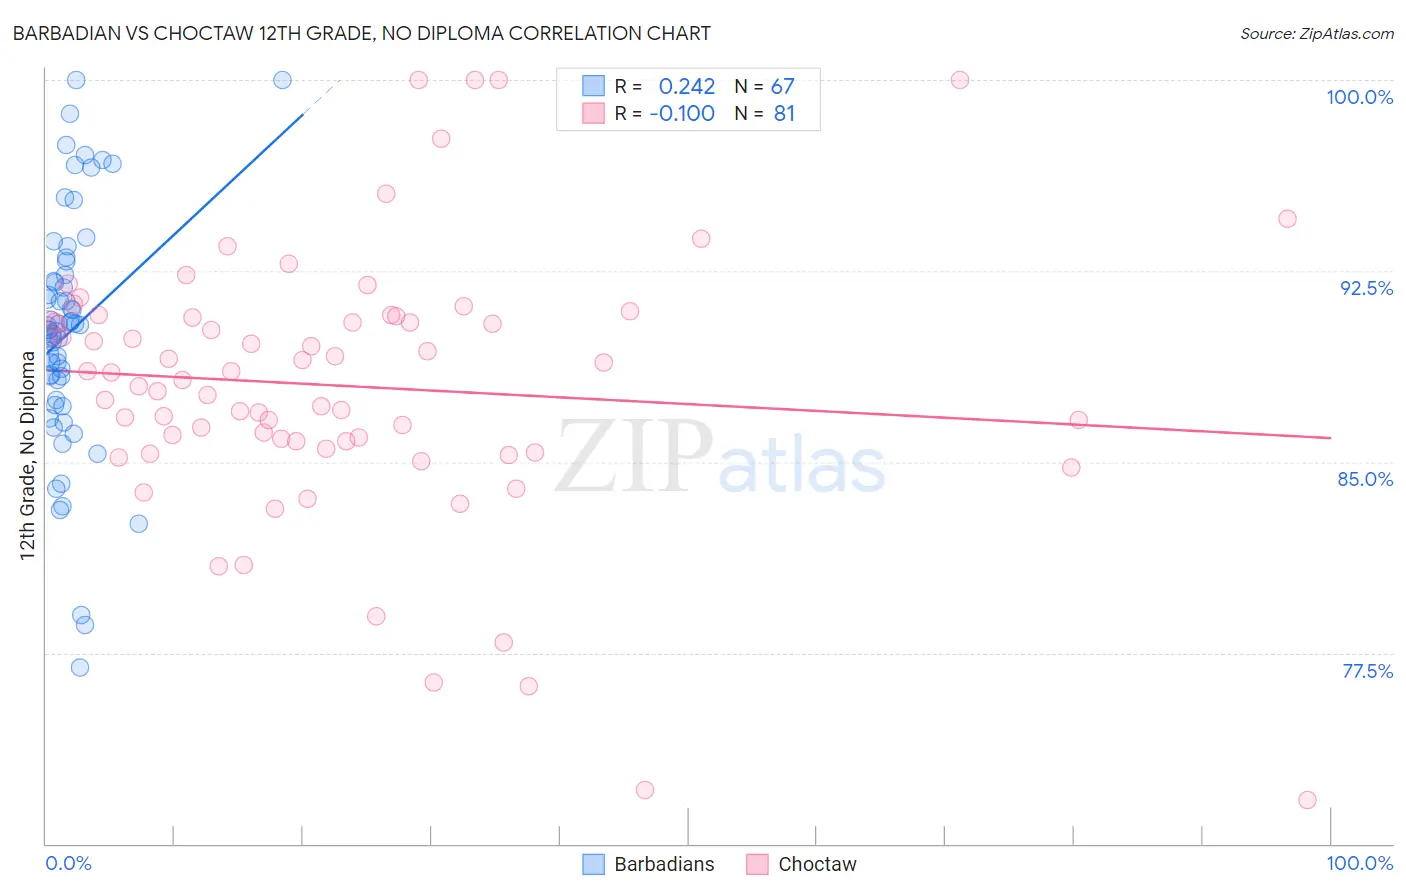
Barbadian vs Choctaw 12th Grade, No Diploma Correlation Chart
The statistical analysis conducted on geographies consisting of 141,304,590 people shows a weak positive correlation between the proportion of Barbadians and percentage of population with at least 12th grade (no diploma) education in the United States with a correlation coefficient (R) of 0.242 and weighted average of 89.1%. Similarly, the statistical analysis conducted on geographies consisting of 269,738,650 people shows a slight negative correlation between the proportion of Choctaw and percentage of population with at least 12th grade (no diploma) education in the United States with a correlation coefficient (R) of -0.100 and weighted average of 89.8%, a difference of 0.73%.
12th Grade, No Diploma Correlation Summary
| Measurement | Barbadian | Choctaw |
| Minimum | 76.9% | 71.7% |
| Maximum | 100.0% | 100.0% |
| Range | 23.1% | 28.3% |
| Mean | 90.1% | 88.0% |
| Median | 90.2% | 88.2% |
| Interquartile 25% (IQ1) | 87.4% | 85.6% |
| Interquartile 75% (IQ3) | 92.3% | 90.7% |
| Interquartile Range (IQR) | 4.9% | 5.0% |
| Standard Deviation (Sample) | 4.7% | 5.4% |
| Standard Deviation (Population) | 4.7% | 5.3% |
Demographics Similar to Barbadians and Choctaw by 12th Grade, No Diploma
In terms of 12th grade, no diploma, the demographic groups most similar to Barbadians are Malaysian (89.2%, a difference of 0.13%), Bangladeshi (89.3%, a difference of 0.14%), Black/African American (89.3%, a difference of 0.14%), U.S. Virgin Islander (89.3%, a difference of 0.19%), and Immigrants from Trinidad and Tobago (89.3%, a difference of 0.22%). Similarly, the demographic groups most similar to Choctaw are Immigrants from Peru (89.7%, a difference of 0.090%), Immigrants from Senegal (89.7%, a difference of 0.10%), Immigrants from Ghana (89.7%, a difference of 0.11%), Jamaican (89.7%, a difference of 0.11%), and African (89.6%, a difference of 0.16%).
| Demographics | Rating | Rank | 12th Grade, No Diploma |
| Choctaw | 0.7 /100 | #253 | Tragic 89.8% |
| Immigrants | Peru | 0.5 /100 | #254 | Tragic 89.7% |
| Immigrants | Senegal | 0.5 /100 | #255 | Tragic 89.7% |
| Immigrants | Ghana | 0.5 /100 | #256 | Tragic 89.7% |
| Jamaicans | 0.5 /100 | #257 | Tragic 89.7% |
| Africans | 0.4 /100 | #258 | Tragic 89.6% |
| Immigrants | Western Africa | 0.4 /100 | #259 | Tragic 89.6% |
| Immigrants | South Eastern Asia | 0.4 /100 | #260 | Tragic 89.6% |
| Cheyenne | 0.4 /100 | #261 | Tragic 89.6% |
| Sioux | 0.4 /100 | #262 | Tragic 89.6% |
| Immigrants | Jamaica | 0.2 /100 | #263 | Tragic 89.5% |
| Sri Lankans | 0.2 /100 | #264 | Tragic 89.4% |
| Trinidadians and Tobagonians | 0.2 /100 | #265 | Tragic 89.4% |
| Seminole | 0.2 /100 | #266 | Tragic 89.4% |
| West Indians | 0.2 /100 | #267 | Tragic 89.3% |
| Immigrants | Trinidad and Tobago | 0.1 /100 | #268 | Tragic 89.3% |
| U.S. Virgin Islanders | 0.1 /100 | #269 | Tragic 89.3% |
| Bangladeshis | 0.1 /100 | #270 | Tragic 89.3% |
| Blacks/African Americans | 0.1 /100 | #271 | Tragic 89.3% |
| Malaysians | 0.1 /100 | #272 | Tragic 89.2% |
| Barbadians | 0.1 /100 | #273 | Tragic 89.1% |