Bangladeshi vs Slovak Kindergarten

COMPARE

Bangladeshi
Race
Ancestry
AfghanAfricanAlaska NativeAlaskan AthabascanAlbanianAleutAlsatianAmericanApacheArabArapahoArgentineanArmenianAssyrian/Chaldean/SyriacAustralianAustrianBahamianBangladeshiBarbadianBasqueBelgianBelizeanBermudanBhutaneseBlackfeetBolivianBrazilianBritishBritish West IndianBulgarianBurmeseCajunCambodianCanadianCape VerdeanCarpatho RusynCelticCentral AmericanCentral American IndianCherokeeCheyenneChickasawChileanChineseChippewaChoctawColombianColvilleComancheCosta RicanCreeCreekCroatianCrowCubanCypriotCzechCzechoslovakianDanishDelawareDominicanDutchDutch West IndianEastern EuropeanEcuadorianEgyptianEnglishEstonianEthiopianEuropeanFijianFilipinoFinnishFrenchFrench American IndianFrench CanadianGermanGerman RussianGhanaianGreekGuamanian/ChamorroGuatemalanGuyaneseHaitianHmongHonduranHopiHoumaHungarianIcelanderIndian (Asian)IndonesianInupiatIranianIraqiIrishIroquoisIsraeliItalianJamaicanJapaneseJordanianKenyanKiowaKoreanLaotianLatvianLebaneseLiberianLithuanianLumbeeLuxembourgerMacedonianMalaysianMalteseMarshalleseMenomineeMexicanMexican American IndianMongolianMoroccanNative HawaiianNavajoNepaleseNew ZealanderNicaraguanNigerianNorthern EuropeanNorwegianOkinawanOsageOttawaPaiutePakistaniPalestinianPanamanianParaguayanPennsylvania GermanPeruvianPimaPolishPortuguesePotawatomiPuebloPuerto RicanPuget Sound SalishRomanianRussianSalvadoranSamoanScandinavianScotch-IrishScottishSeminoleSenegaleseSerbianShoshoneSierra LeoneanSiouxSlavicSloveneSomaliSouth AfricanSouth AmericanSouth American IndianSoviet UnionSpaniardSpanishSpanish AmericanSpanish American IndianSri LankanSubsaharan AfricanSudaneseSwedishSwissSyrianTaiwaneseThaiTlingit-HaidaTohono O'OdhamTonganTrinidadian and TobagonianTsimshianTurkishU.S. Virgin IslanderUgandanUkrainianUruguayanUteVenezuelanVietnameseWelshWest IndianYakamaYaquiYugoslavianYumanYup'ikZimbabwean
Immigration
NonimmigrantsImmigrantsAfghanistanAfricaAlbaniaArgentinaArmeniaAsiaAustraliaAustriaBahamasBangladeshBarbadosBelarusBelgiumBelizeBoliviaBosnia and HerzegovinaBrazilBulgariaBurma/MyanmarCabo VerdeCambodiaCameroonCanadaCaribbeanCentral AmericaChileChinaColombiaCongoCosta RicaCroatiaCubaCzechoslovakiaDenmarkDominicaDominican RepublicEastern AfricaEastern AsiaEastern EuropeEcuadorEgyptEl SalvadorEnglandEritreaEthiopiaEuropeFijiFranceGermanyGhanaGreeceGrenadaGuatemalaGuyanaHaitiHondurasHong KongHungaryIndiaIndonesiaIranIraqIrelandIsraelItalyJamaicaJapanJordanKazakhstanKenyaKoreaKuwaitLaosLatin AmericaLatviaLebanonLiberiaLithuaniaMalaysiaMexicoMicronesiaMiddle AfricaMoldovaMoroccoNepalNetherlandsNicaraguaNigeriaNorth AmericaNorth MacedoniaNorthern AfricaNorthern EuropeNorwayOceaniaPakistanPanamaPeruPhilippinesPolandPortugalRomaniaRussiaSaudi ArabiaScotlandSenegalSerbiaSierra LeoneSingaporeSomaliaSouth AfricaSouth AmericaSouth Central AsiaSouth Eastern AsiaSouthern EuropeSpainSri LankaSt. Vincent and the GrenadinesSudanSwedenSwitzerlandSyriaTaiwanThailandTrinidad and TobagoTurkeyUgandaUkraineUruguayUzbekistanVenezuelaVietnamWest IndiesWestern AfricaWestern AsiaWestern EuropeYemenZaireZimbabweAzores
Slovak
Race
Ancestry
AfghanAfricanAlaska NativeAlaskan AthabascanAlbanianAleutAlsatianAmericanApacheArabArapahoArgentineanArmenianAssyrian/Chaldean/SyriacAustralianAustrianBahamianBarbadianBasqueBelgianBelizeanBermudanBhutaneseBlackfeetBolivianBrazilianBritishBritish West IndianBulgarianBurmeseCajunCambodianCanadianCape VerdeanCarpatho RusynCelticCentral AmericanCentral American IndianCherokeeCheyenneChickasawChileanChineseChippewaChoctawColombianColvilleComancheCosta RicanCreeCreekCroatianCrowCubanCypriotCzechCzechoslovakianDanishDelawareDominicanDutchDutch West IndianEastern EuropeanEcuadorianEgyptianEnglishEstonianEthiopianEuropeanFijianFilipinoFinnishFrenchFrench American IndianFrench CanadianGermanGerman RussianGhanaianGreekGuamanian/ChamorroGuatemalanGuyaneseHaitianHmongHonduranHopiHoumaHungarianIcelanderIndian (Asian)IndonesianInupiatIranianIraqiIrishIroquoisIsraeliItalianJamaicanJapaneseJordanianKenyanKiowaKoreanLaotianLatvianLebaneseLiberianLithuanianLumbeeLuxembourgerMacedonianMalaysianMalteseMarshalleseMenomineeMexicanMexican American IndianMongolianMoroccanNative HawaiianNavajoNepaleseNew ZealanderNicaraguanNigerianNorthern EuropeanNorwegianOkinawanOsageOttawaPaiutePakistaniPalestinianPanamanianParaguayanPennsylvania GermanPeruvianPimaPolishPortuguesePotawatomiPuebloPuerto RicanPuget Sound SalishRomanianRussianSalvadoranSamoanScandinavianScotch-IrishScottishSeminoleSenegaleseSerbianShoshoneSierra LeoneanSiouxSlavicSlovakSloveneSomaliSouth AfricanSouth AmericanSouth American IndianSoviet UnionSpaniardSpanishSpanish AmericanSpanish American IndianSri LankanSubsaharan AfricanSudaneseSwedishSwissSyrianTaiwaneseThaiTlingit-HaidaTohono O'OdhamTonganTrinidadian and TobagonianTsimshianTurkishU.S. Virgin IslanderUgandanUkrainianUruguayanUteVenezuelanVietnameseWelshWest IndianYakamaYaquiYugoslavianYumanYup'ikZimbabwean
Immigration
NonimmigrantsImmigrantsAfghanistanAfricaAlbaniaArgentinaArmeniaAsiaAustraliaAustriaBahamasBangladeshBarbadosBelarusBelgiumBelizeBoliviaBosnia and HerzegovinaBrazilBulgariaBurma/MyanmarCabo VerdeCambodiaCameroonCanadaCaribbeanCentral AmericaChileChinaColombiaCongoCosta RicaCroatiaCubaCzechoslovakiaDenmarkDominicaDominican RepublicEastern AfricaEastern AsiaEastern EuropeEcuadorEgyptEl SalvadorEnglandEritreaEthiopiaEuropeFijiFranceGermanyGhanaGreeceGrenadaGuatemalaGuyanaHaitiHondurasHong KongHungaryIndiaIndonesiaIranIraqIrelandIsraelItalyJamaicaJapanJordanKazakhstanKenyaKoreaKuwaitLaosLatin AmericaLatviaLebanonLiberiaLithuaniaMalaysiaMexicoMicronesiaMiddle AfricaMoldovaMoroccoNepalNetherlandsNicaraguaNigeriaNorth AmericaNorth MacedoniaNorthern AfricaNorthern EuropeNorwayOceaniaPakistanPanamaPeruPhilippinesPolandPortugalRomaniaRussiaSaudi ArabiaScotlandSenegalSerbiaSierra LeoneSingaporeSomaliaSouth AfricaSouth AmericaSouth Central AsiaSouth Eastern AsiaSouthern EuropeSpainSri LankaSt. Vincent and the GrenadinesSudanSwedenSwitzerlandSyriaTaiwanThailandTrinidad and TobagoTurkeyUgandaUkraineUruguayUzbekistanVenezuelaVietnamWest IndiesWestern AfricaWestern AsiaWestern EuropeYemenZaireZimbabweAzores
Kindergarten
Income
Poverty
Unemployment
Labor Participation
Family Structure
Vehicle Availability
Education Level
Disability

Kindergarten Comparison

Bangladeshis

Slovaks

Tragic
Exceptional
96.6%
KINDERGARTEN
0.0/ 100
METRIC RATING
335th/ 347
METRIC RANK
98.7%
KINDERGARTEN
100.0/ 100
METRIC RATING
10th/ 347
METRIC RANK

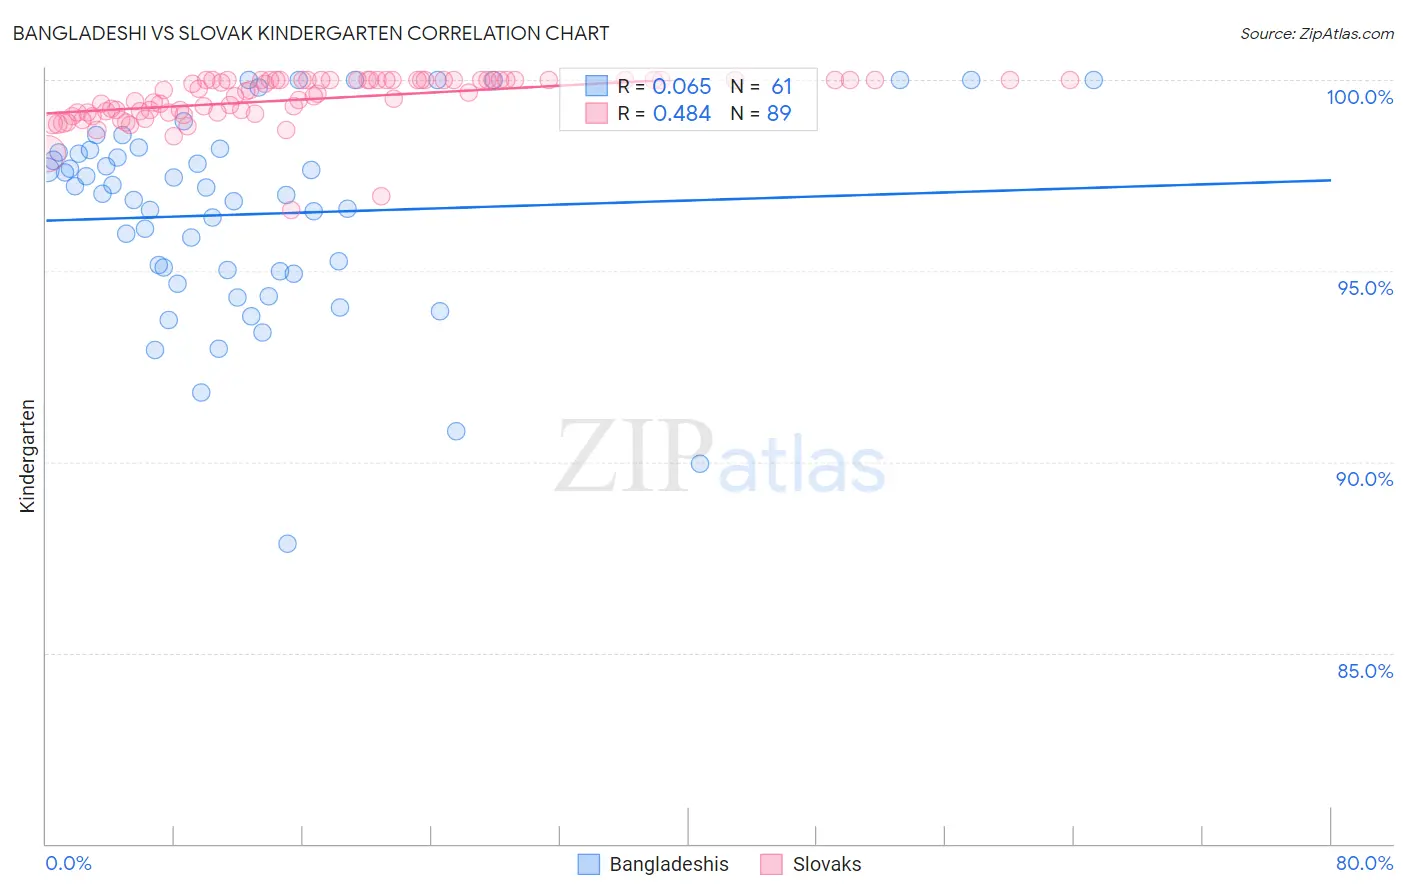
Bangladeshi vs Slovak Kindergarten Correlation Chart

The statistical analysis conducted on geographies consisting of 141,430,495 people shows a slight positive correlation between the proportion of Bangladeshis and percentage of population with at least kindergarten education in the United States with a correlation coefficient (R) of 0.065 and weighted average of 96.6%. Similarly, the statistical analysis conducted on geographies consisting of 397,891,514 people shows a moderate positive correlation between the proportion of Slovaks and percentage of population with at least kindergarten education in the United States with a correlation coefficient (R) of 0.484 and weighted average of 98.7%, a difference of 2.2%.
Bangladeshi vs Slovak Kindergarten

Kindergarten Correlation Summary

MeasurementBangladeshiSlovak
Minimum87.9%96.6%
Maximum100.0%100.0%
Range12.1%3.4%
Mean96.5%99.5%
Median97.0%99.7%
Interquartile 25% (IQ1)95.0%99.1%
Interquartile 75% (IQ3)98.1%100.0%
Interquartile Range (IQR)3.2%0.86%
Standard Deviation (Sample)2.6%0.63%
Standard Deviation (Population)2.6%0.63%

Similar Demographics by Kindergarten

Demographics Similar to Bangladeshis by Kindergarten

In terms of kindergarten, the demographic groups most similar to Bangladeshis are Immigrants from Dominican Republic (96.6%, a difference of 0.0%), Central American (96.6%, a difference of 0.030%), Guatemalan (96.5%, a difference of 0.030%), Yakama (96.6%, a difference of 0.050%), and Immigrants from Armenia (96.6%, a difference of 0.070%).
DemographicsRating | RankKindergarten
Immigrants | Latin America
0.0
/100
|
#328
Tragic
96.7%
Immigrants | Vietnam
0.0
/100
|
#329
Tragic
96.7%
Japanese
0.0
/100
|
#330
Tragic
96.7%
Immigrants | Armenia
0.0
/100
|
#331
Tragic
96.6%
Yakama
0.0
/100
|
#332
Tragic
96.6%
Central Americans
0.0
/100
|
#333
Tragic
96.6%
Immigrants | Dominican Republic
0.0
/100
|
#334
Tragic
96.6%
Bangladeshis
0.0
/100
|
#335
Tragic
96.6%
Guatemalans
0.0
/100
|
#336
Tragic
96.5%
Immigrants | Cambodia
0.0
/100
|
#337
Tragic
96.5%
Immigrants | Fiji
0.0
/100
|
#338
Tragic
96.5%
Immigrants | Guatemala
0.0
/100
|
#339
Tragic
96.4%
Immigrants | Central America
0.0
/100
|
#340
Tragic
96.4%
Immigrants | Cabo Verde
0.0
/100
|
#341
Tragic
96.4%
Immigrants | Mexico
0.0
/100
|
#342
Tragic
96.4%

Demographics Similar to Slovaks by Kindergarten

In terms of kindergarten, the demographic groups most similar to Slovaks are Tlingit-Haida (98.7%, a difference of 0.0%), German (98.7%, a difference of 0.0%), Norwegian (98.7%, a difference of 0.020%), Slovene (98.7%, a difference of 0.030%), and Alaska Native (98.7%, a difference of 0.040%).
DemographicsRating | RankKindergarten
Inupiat
100.0
/100
|
#3
Exceptional
98.9%
Welsh
100.0
/100
|
#4
Exceptional
98.9%
Tsimshian
100.0
/100
|
#5
Exceptional
98.8%
Alaskan Athabascans
100.0
/100
|
#6
Exceptional
98.8%
Alaska Natives
100.0
/100
|
#7
Exceptional
98.7%
Norwegians
100.0
/100
|
#8
Exceptional
98.7%
Tlingit-Haida
100.0
/100
|
#9
Exceptional
98.7%
Slovaks
100.0
/100
|
#10
Exceptional
98.7%
Germans
100.0
/100
|
#11
Exceptional
98.7%
Slovenes
100.0
/100
|
#12
Exceptional
98.7%
Carpatho Rusyns
100.0
/100
|
#13
Exceptional
98.7%
English
100.0
/100
|
#14
Exceptional
98.7%
Swedes
100.0
/100
|
#15
Exceptional
98.7%
Aleuts
100.0
/100
|
#16
Exceptional
98.6%
Scottish
100.0
/100
|
#17
Exceptional
98.6%