Bangladeshi vs Creek College, 1 year or more
COMPARE
Bangladeshi
Creek
College, 1 year or more
College, 1 year or more Comparison
Bangladeshis
Creek
54.5%
COLLEGE, 1 YEAR OR MORE
0.2/ 100
METRIC RATING
269th/ 347
METRIC RANK
52.2%
COLLEGE, 1 YEAR OR MORE
0.0/ 100
METRIC RATING
303rd/ 347
METRIC RANK
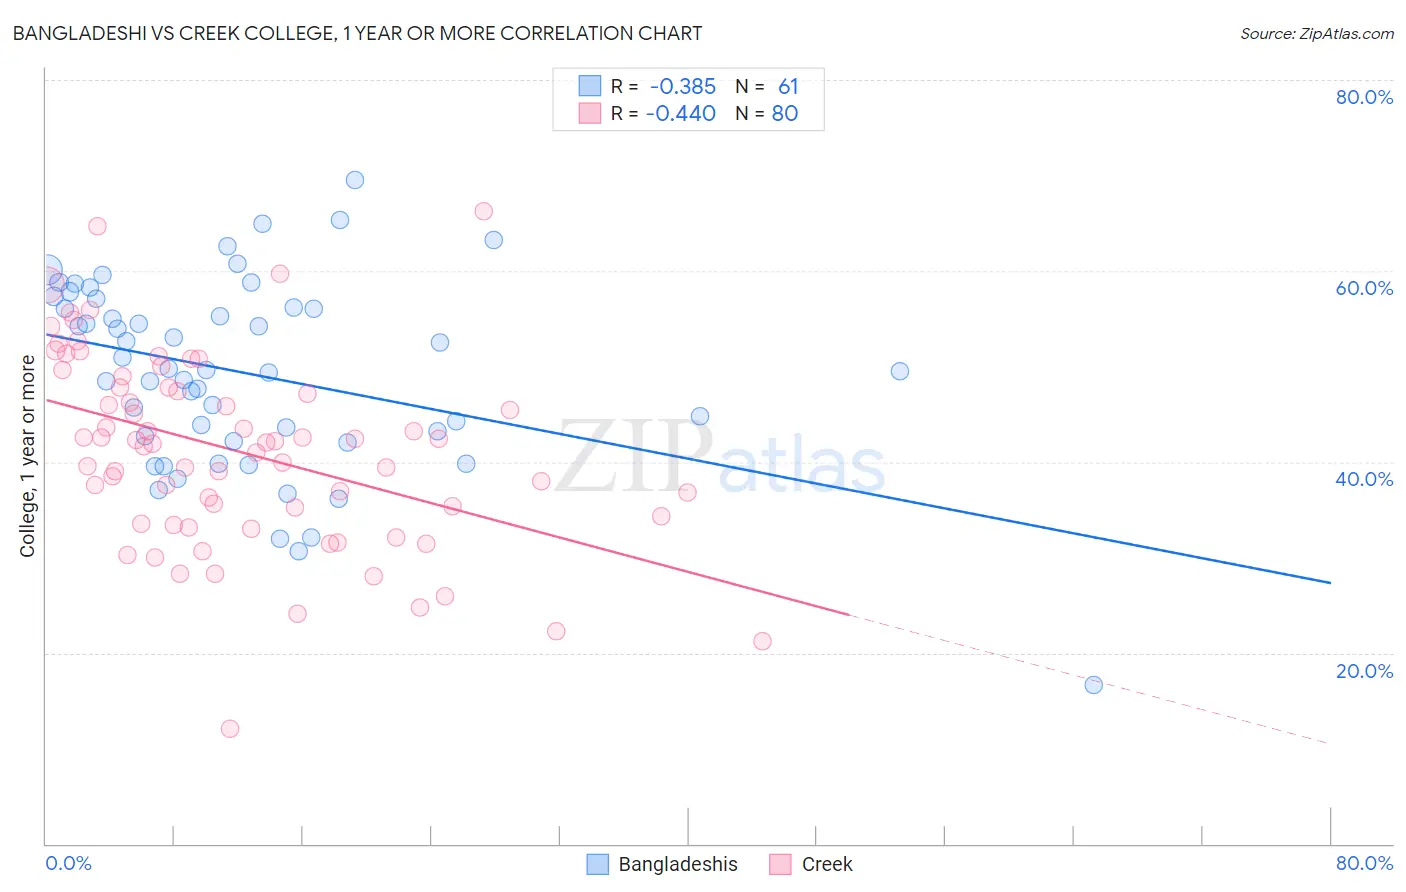
Bangladeshi vs Creek College, 1 year or more Correlation Chart
The statistical analysis conducted on geographies consisting of 141,449,898 people shows a mild negative correlation between the proportion of Bangladeshis and percentage of population with at least college, 1 year or more education in the United States with a correlation coefficient (R) of -0.385 and weighted average of 54.5%. Similarly, the statistical analysis conducted on geographies consisting of 178,480,714 people shows a moderate negative correlation between the proportion of Creek and percentage of population with at least college, 1 year or more education in the United States with a correlation coefficient (R) of -0.440 and weighted average of 52.2%, a difference of 4.4%.
College, 1 year or more Correlation Summary
| Measurement | Bangladeshi | Creek |
| Minimum | 16.7% | 12.0% |
| Maximum | 69.6% | 66.3% |
| Range | 52.9% | 54.2% |
| Mean | 49.3% | 41.1% |
| Median | 49.6% | 42.0% |
| Interquartile 25% (IQ1) | 42.4% | 33.9% |
| Interquartile 75% (IQ3) | 56.6% | 47.8% |
| Interquartile Range (IQR) | 14.2% | 13.9% |
| Standard Deviation (Sample) | 10.0% | 10.1% |
| Standard Deviation (Population) | 9.9% | 10.1% |
Similar Demographics by College, 1 year or more
Demographics Similar to Bangladeshis by College, 1 year or more
In terms of college, 1 year or more, the demographic groups most similar to Bangladeshis are British West Indian (54.5%, a difference of 0.030%), Crow (54.5%, a difference of 0.030%), Bahamian (54.5%, a difference of 0.060%), Comanche (54.4%, a difference of 0.10%), and Immigrants from Grenada (54.4%, a difference of 0.14%).
| Demographics | Rating | Rank | College, 1 year or more |
| Immigrants | St. Vincent and the Grenadines | 0.3 /100 | #262 | Tragic 54.8% |
| U.S. Virgin Islanders | 0.3 /100 | #263 | Tragic 54.8% |
| Immigrants | Micronesia | 0.3 /100 | #264 | Tragic 54.8% |
| Immigrants | Laos | 0.2 /100 | #265 | Tragic 54.7% |
| Potawatomi | 0.2 /100 | #266 | Tragic 54.6% |
| Blackfeet | 0.2 /100 | #267 | Tragic 54.6% |
| British West Indians | 0.2 /100 | #268 | Tragic 54.5% |
| Bangladeshis | 0.2 /100 | #269 | Tragic 54.5% |
| Crow | 0.2 /100 | #270 | Tragic 54.5% |
| Bahamians | 0.2 /100 | #271 | Tragic 54.5% |
| Comanche | 0.2 /100 | #272 | Tragic 54.4% |
| Immigrants | Grenada | 0.2 /100 | #273 | Tragic 54.4% |
| Belizeans | 0.2 /100 | #274 | Tragic 54.4% |
| Americans | 0.2 /100 | #275 | Tragic 54.4% |
| Shoshone | 0.2 /100 | #276 | Tragic 54.3% |
Demographics Similar to Creek by College, 1 year or more
In terms of college, 1 year or more, the demographic groups most similar to Creek are Puerto Rican (52.2%, a difference of 0.080%), Central American (52.1%, a difference of 0.14%), Haitian (52.3%, a difference of 0.21%), Seminole (52.1%, a difference of 0.23%), and Choctaw (52.3%, a difference of 0.26%).
| Demographics | Rating | Rank | College, 1 year or more |
| Sioux | 0.0 /100 | #296 | Tragic 53.0% |
| Paiute | 0.0 /100 | #297 | Tragic 52.9% |
| Immigrants | Dominica | 0.0 /100 | #298 | Tragic 52.5% |
| Immigrants | Nicaragua | 0.0 /100 | #299 | Tragic 52.4% |
| Choctaw | 0.0 /100 | #300 | Tragic 52.3% |
| Haitians | 0.0 /100 | #301 | Tragic 52.3% |
| Puerto Ricans | 0.0 /100 | #302 | Tragic 52.2% |
| Creek | 0.0 /100 | #303 | Tragic 52.2% |
| Central Americans | 0.0 /100 | #304 | Tragic 52.1% |
| Seminole | 0.0 /100 | #305 | Tragic 52.1% |
| Mexican American Indians | 0.0 /100 | #306 | Tragic 51.9% |
| Immigrants | Portugal | 0.0 /100 | #307 | Tragic 51.9% |
| Salvadorans | 0.0 /100 | #308 | Tragic 51.8% |
| Apache | 0.0 /100 | #309 | Tragic 51.8% |
| Hondurans | 0.0 /100 | #310 | Tragic 51.6% |