Austrian vs Immigrants from North Macedonia 11th Grade
COMPARE
Austrian
Immigrants from North Macedonia
11th Grade
11th Grade Comparison
Austrians
Immigrants from North Macedonia
94.0%
11TH GRADE
99.8/ 100
METRIC RATING
62nd/ 347
METRIC RANK
93.5%
11TH GRADE
98.7/ 100
METRIC RATING
100th/ 347
METRIC RANK
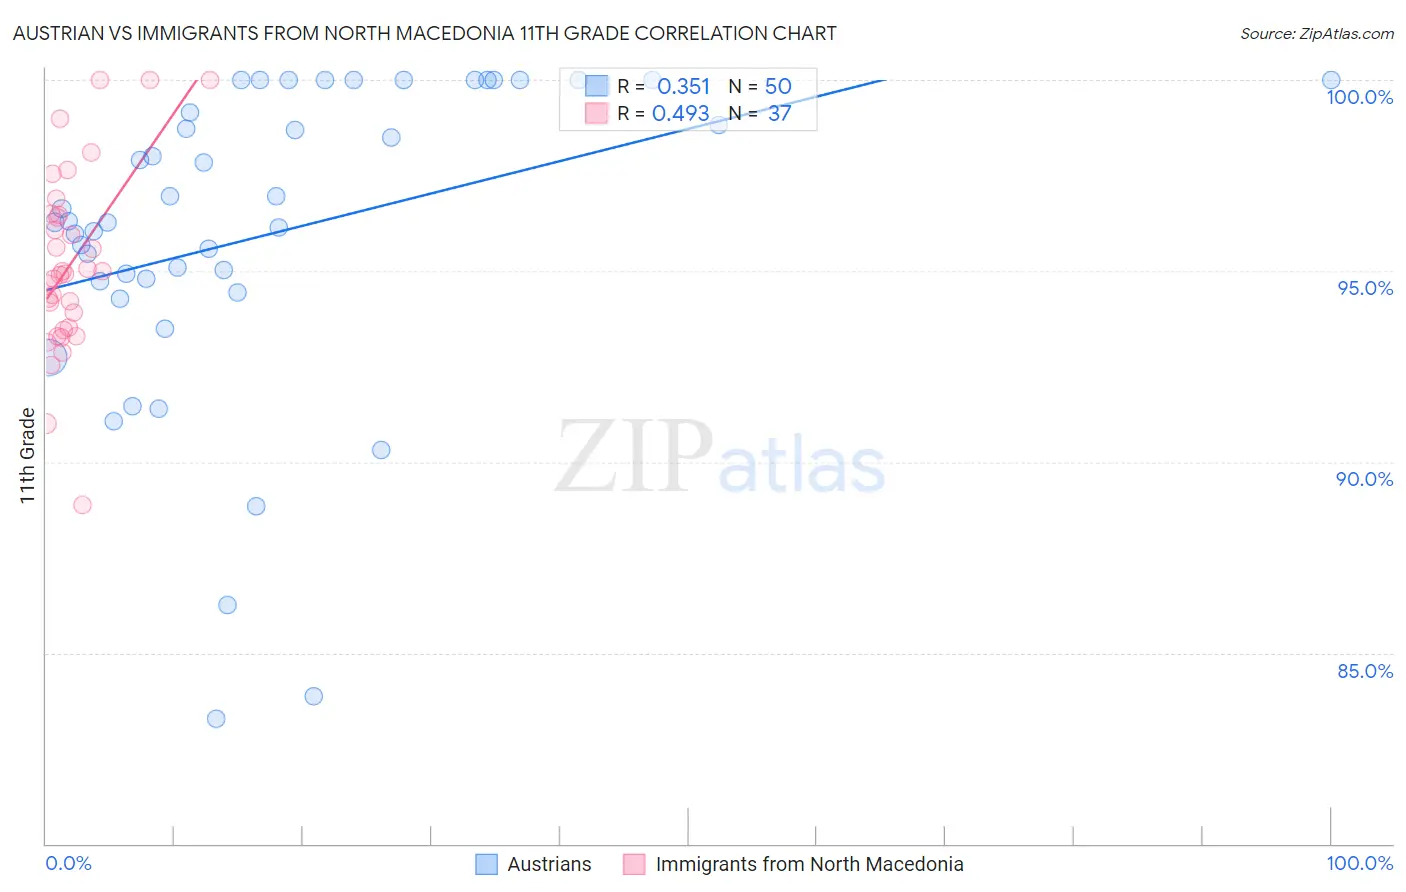
Austrian vs Immigrants from North Macedonia 11th Grade Correlation Chart
The statistical analysis conducted on geographies consisting of 452,082,820 people shows a mild positive correlation between the proportion of Austrians and percentage of population with at least 11th grade education in the United States with a correlation coefficient (R) of 0.351 and weighted average of 94.0%. Similarly, the statistical analysis conducted on geographies consisting of 74,300,344 people shows a moderate positive correlation between the proportion of Immigrants from North Macedonia and percentage of population with at least 11th grade education in the United States with a correlation coefficient (R) of 0.493 and weighted average of 93.5%, a difference of 0.51%.
11th Grade Correlation Summary
| Measurement | Austrian | Immigrants from North Macedonia |
| Minimum | 83.3% | 88.9% |
| Maximum | 100.0% | 100.0% |
| Range | 16.7% | 11.1% |
| Mean | 96.0% | 95.2% |
| Median | 96.3% | 94.9% |
| Interquartile 25% (IQ1) | 94.7% | 93.5% |
| Interquartile 75% (IQ3) | 100.0% | 96.5% |
| Interquartile Range (IQR) | 5.3% | 3.0% |
| Standard Deviation (Sample) | 4.1% | 2.4% |
| Standard Deviation (Population) | 4.1% | 2.4% |
Similar Demographics by 11th Grade
Demographics Similar to Austrians by 11th Grade
In terms of 11th grade, the demographic groups most similar to Austrians are Immigrants from Belgium (94.0%, a difference of 0.0%), French Canadian (94.0%, a difference of 0.010%), New Zealander (94.0%, a difference of 0.010%), Iranian (94.0%, a difference of 0.010%), and Bhutanese (94.0%, a difference of 0.010%).
| Demographics | Rating | Rank | 11th Grade |
| Czechoslovakians | 99.9 /100 | #55 | Exceptional 94.0% |
| French Canadians | 99.9 /100 | #56 | Exceptional 94.0% |
| New Zealanders | 99.9 /100 | #57 | Exceptional 94.0% |
| Iranians | 99.9 /100 | #58 | Exceptional 94.0% |
| Bhutanese | 99.8 /100 | #59 | Exceptional 94.0% |
| Okinawans | 99.8 /100 | #60 | Exceptional 94.0% |
| Immigrants | Belgium | 99.8 /100 | #61 | Exceptional 94.0% |
| Austrians | 99.8 /100 | #62 | Exceptional 94.0% |
| Ukrainians | 99.8 /100 | #63 | Exceptional 94.0% |
| Immigrants | Sweden | 99.8 /100 | #64 | Exceptional 93.9% |
| Native Hawaiians | 99.8 /100 | #65 | Exceptional 93.9% |
| Alaskan Athabascans | 99.8 /100 | #66 | Exceptional 93.9% |
| Immigrants | Netherlands | 99.8 /100 | #67 | Exceptional 93.9% |
| Zimbabweans | 99.8 /100 | #68 | Exceptional 93.9% |
| Scotch-Irish | 99.8 /100 | #69 | Exceptional 93.9% |
Demographics Similar to Immigrants from North Macedonia by 11th Grade
In terms of 11th grade, the demographic groups most similar to Immigrants from North Macedonia are Immigrants from Israel (93.5%, a difference of 0.010%), Menominee (93.5%, a difference of 0.010%), Immigrants from Romania (93.5%, a difference of 0.010%), Chippewa (93.5%, a difference of 0.020%), and Lebanese (93.5%, a difference of 0.020%).
| Demographics | Rating | Rank | 11th Grade |
| Puget Sound Salish | 99.1 /100 | #93 | Exceptional 93.6% |
| Swiss | 99.0 /100 | #94 | Exceptional 93.6% |
| Immigrants | France | 99.0 /100 | #95 | Exceptional 93.6% |
| Immigrants | Turkey | 98.9 /100 | #96 | Exceptional 93.5% |
| Immigrants | Iran | 98.9 /100 | #97 | Exceptional 93.5% |
| Immigrants | Israel | 98.8 /100 | #98 | Exceptional 93.5% |
| Menominee | 98.7 /100 | #99 | Exceptional 93.5% |
| Immigrants | North Macedonia | 98.7 /100 | #100 | Exceptional 93.5% |
| Immigrants | Romania | 98.7 /100 | #101 | Exceptional 93.5% |
| Chippewa | 98.6 /100 | #102 | Exceptional 93.5% |
| Lebanese | 98.6 /100 | #103 | Exceptional 93.5% |
| Immigrants | Europe | 98.6 /100 | #104 | Exceptional 93.5% |
| Immigrants | Serbia | 98.6 /100 | #105 | Exceptional 93.5% |
| Immigrants | Croatia | 98.6 /100 | #106 | Exceptional 93.5% |
| Immigrants | Norway | 98.4 /100 | #107 | Exceptional 93.5% |