Austrian vs Immigrants from Europe High School Diploma

COMPARE

Austrian
Race
Ancestry
AfghanAfricanAlaska NativeAlaskan AthabascanAlbanianAleutAlsatianAmericanApacheArabArapahoArgentineanArmenianAssyrian/Chaldean/SyriacAustralianAustrianBahamianBangladeshiBarbadianBasqueBelgianBelizeanBermudanBhutaneseBlackfeetBolivianBrazilianBritishBritish West IndianBulgarianBurmeseCajunCambodianCanadianCape VerdeanCarpatho RusynCelticCentral AmericanCentral American IndianCherokeeCheyenneChickasawChileanChineseChippewaChoctawColombianColvilleComancheCosta RicanCreeCreekCroatianCrowCubanCypriotCzechCzechoslovakianDanishDelawareDominicanDutchDutch West IndianEastern EuropeanEcuadorianEgyptianEnglishEstonianEthiopianEuropeanFijianFilipinoFinnishFrenchFrench American IndianFrench CanadianGermanGerman RussianGhanaianGreekGuamanian/ChamorroGuatemalanGuyaneseHaitianHmongHonduranHopiHoumaHungarianIcelanderIndian (Asian)IndonesianInupiatIranianIraqiIrishIroquoisIsraeliItalianJamaicanJapaneseJordanianKenyanKiowaKoreanLaotianLatvianLebaneseLiberianLithuanianLumbeeLuxembourgerMacedonianMalaysianMalteseMarshalleseMenomineeMexicanMexican American IndianMongolianMoroccanNative HawaiianNavajoNepaleseNew ZealanderNicaraguanNigerianNorthern EuropeanNorwegianOkinawanOsageOttawaPaiutePakistaniPalestinianPanamanianParaguayanPennsylvania GermanPeruvianPimaPolishPortuguesePotawatomiPuebloPuerto RicanPuget Sound SalishRomanianRussianSalvadoranSamoanScandinavianScotch-IrishScottishSeminoleSenegaleseSerbianShoshoneSierra LeoneanSiouxSlavicSlovakSloveneSomaliSouth AfricanSouth AmericanSouth American IndianSoviet UnionSpaniardSpanishSpanish AmericanSpanish American IndianSri LankanSubsaharan AfricanSudaneseSwedishSwissSyrianTaiwaneseThaiTlingit-HaidaTohono O'OdhamTonganTrinidadian and TobagonianTsimshianTurkishU.S. Virgin IslanderUgandanUkrainianUruguayanUteVenezuelanVietnameseWelshWest IndianYakamaYaquiYugoslavianYumanYup'ikZimbabwean
Immigration
NonimmigrantsImmigrantsAfghanistanAfricaAlbaniaArgentinaArmeniaAsiaAustraliaAustriaBahamasBangladeshBarbadosBelarusBelgiumBelizeBoliviaBosnia and HerzegovinaBrazilBulgariaBurma/MyanmarCabo VerdeCambodiaCameroonCanadaCaribbeanCentral AmericaChileChinaColombiaCongoCosta RicaCroatiaCubaCzechoslovakiaDenmarkDominicaDominican RepublicEastern AfricaEastern AsiaEastern EuropeEcuadorEgyptEl SalvadorEnglandEritreaEthiopiaFijiFranceGermanyGhanaGreeceGrenadaGuatemalaGuyanaHaitiHondurasHong KongHungaryIndiaIndonesiaIranIraqIrelandIsraelItalyJamaicaJapanJordanKazakhstanKenyaKoreaKuwaitLaosLatin AmericaLatviaLebanonLiberiaLithuaniaMalaysiaMexicoMicronesiaMiddle AfricaMoldovaMoroccoNepalNetherlandsNicaraguaNigeriaNorth AmericaNorth MacedoniaNorthern AfricaNorthern EuropeNorwayOceaniaPakistanPanamaPeruPhilippinesPolandPortugalRomaniaRussiaSaudi ArabiaScotlandSenegalSerbiaSierra LeoneSingaporeSomaliaSouth AfricaSouth AmericaSouth Central AsiaSouth Eastern AsiaSouthern EuropeSpainSri LankaSt. Vincent and the GrenadinesSudanSwedenSwitzerlandSyriaTaiwanThailandTrinidad and TobagoTurkeyUgandaUkraineUruguayUzbekistanVenezuelaVietnamWest IndiesWestern AfricaWestern AsiaWestern EuropeYemenZaireZimbabweAzores
Immigrants from Europe
Race
Ancestry
AfghanAfricanAlaska NativeAlaskan AthabascanAlbanianAleutAlsatianAmericanApacheArabArapahoArgentineanArmenianAssyrian/Chaldean/SyriacAustralianBahamianBangladeshiBarbadianBasqueBelgianBelizeanBermudanBhutaneseBlackfeetBolivianBrazilianBritishBritish West IndianBulgarianBurmeseCajunCambodianCanadianCape VerdeanCarpatho RusynCelticCentral AmericanCentral American IndianCherokeeCheyenneChickasawChileanChineseChippewaChoctawColombianColvilleComancheCosta RicanCreeCreekCroatianCrowCubanCypriotCzechCzechoslovakianDanishDelawareDominicanDutchDutch West IndianEastern EuropeanEcuadorianEgyptianEnglishEstonianEthiopianEuropeanFijianFilipinoFinnishFrenchFrench American IndianFrench CanadianGermanGerman RussianGhanaianGreekGuamanian/ChamorroGuatemalanGuyaneseHaitianHmongHonduranHopiHoumaHungarianIcelanderIndian (Asian)IndonesianInupiatIranianIraqiIrishIroquoisIsraeliItalianJamaicanJapaneseJordanianKenyanKiowaKoreanLaotianLatvianLebaneseLiberianLithuanianLumbeeLuxembourgerMacedonianMalaysianMalteseMarshalleseMenomineeMexicanMexican American IndianMongolianMoroccanNative HawaiianNavajoNepaleseNew ZealanderNicaraguanNigerianNorthern EuropeanNorwegianOkinawanOsageOttawaPaiutePakistaniPalestinianPanamanianParaguayanPennsylvania GermanPeruvianPimaPolishPortuguesePotawatomiPuebloPuerto RicanPuget Sound SalishRomanianRussianSalvadoranSamoanScandinavianScotch-IrishScottishSeminoleSenegaleseSerbianShoshoneSierra LeoneanSiouxSlavicSlovakSloveneSomaliSouth AfricanSouth AmericanSouth American IndianSoviet UnionSpaniardSpanishSpanish AmericanSpanish American IndianSri LankanSubsaharan AfricanSudaneseSwedishSwissSyrianTaiwaneseThaiTlingit-HaidaTohono O'OdhamTonganTrinidadian and TobagonianTsimshianTurkishU.S. Virgin IslanderUgandanUkrainianUruguayanUteVenezuelanVietnameseWelshWest IndianYakamaYaquiYugoslavianYumanYup'ikZimbabwean
Immigration
NonimmigrantsImmigrantsAfghanistanAfricaAlbaniaArgentinaArmeniaAsiaAustraliaAustriaBahamasBangladeshBarbadosBelarusBelgiumBelizeBoliviaBosnia and HerzegovinaBrazilBulgariaBurma/MyanmarCabo VerdeCambodiaCameroonCanadaCaribbeanCentral AmericaChileChinaColombiaCongoCosta RicaCroatiaCubaCzechoslovakiaDenmarkDominicaDominican RepublicEastern AfricaEastern AsiaEastern EuropeEcuadorEgyptEl SalvadorEnglandEritreaEthiopiaEuropeFijiFranceGermanyGhanaGreeceGrenadaGuatemalaGuyanaHaitiHondurasHong KongHungaryIndiaIndonesiaIranIraqIrelandIsraelItalyJamaicaJapanJordanKazakhstanKenyaKoreaKuwaitLaosLatin AmericaLatviaLebanonLiberiaLithuaniaMalaysiaMexicoMicronesiaMiddle AfricaMoldovaMoroccoNepalNetherlandsNicaraguaNigeriaNorth AmericaNorth MacedoniaNorthern AfricaNorthern EuropeNorwayOceaniaPakistanPanamaPeruPhilippinesPolandPortugalRomaniaRussiaSaudi ArabiaScotlandSenegalSerbiaSierra LeoneSingaporeSomaliaSouth AfricaSouth AmericaSouth Central AsiaSouth Eastern AsiaSouthern EuropeSpainSri LankaSt. Vincent and the GrenadinesSudanSwedenSwitzerlandSyriaTaiwanThailandTrinidad and TobagoTurkeyUgandaUkraineUruguayUzbekistanVenezuelaVietnamWest IndiesWestern AfricaWestern AsiaWestern EuropeYemenZaireZimbabweAzores
High School Diploma
Income
Poverty
Unemployment
Labor Participation
Family Structure
Vehicle Availability
Education Level
Disability

High School Diploma Comparison

Austrians

Immigrants from Europe

Exceptional
Exceptional
91.0%
HIGH SCHOOL DIPLOMA
99.6/ 100
METRIC RATING
62nd/ 347
METRIC RANK
90.5%
HIGH SCHOOL DIPLOMA
98.2/ 100
METRIC RATING
99th/ 347
METRIC RANK

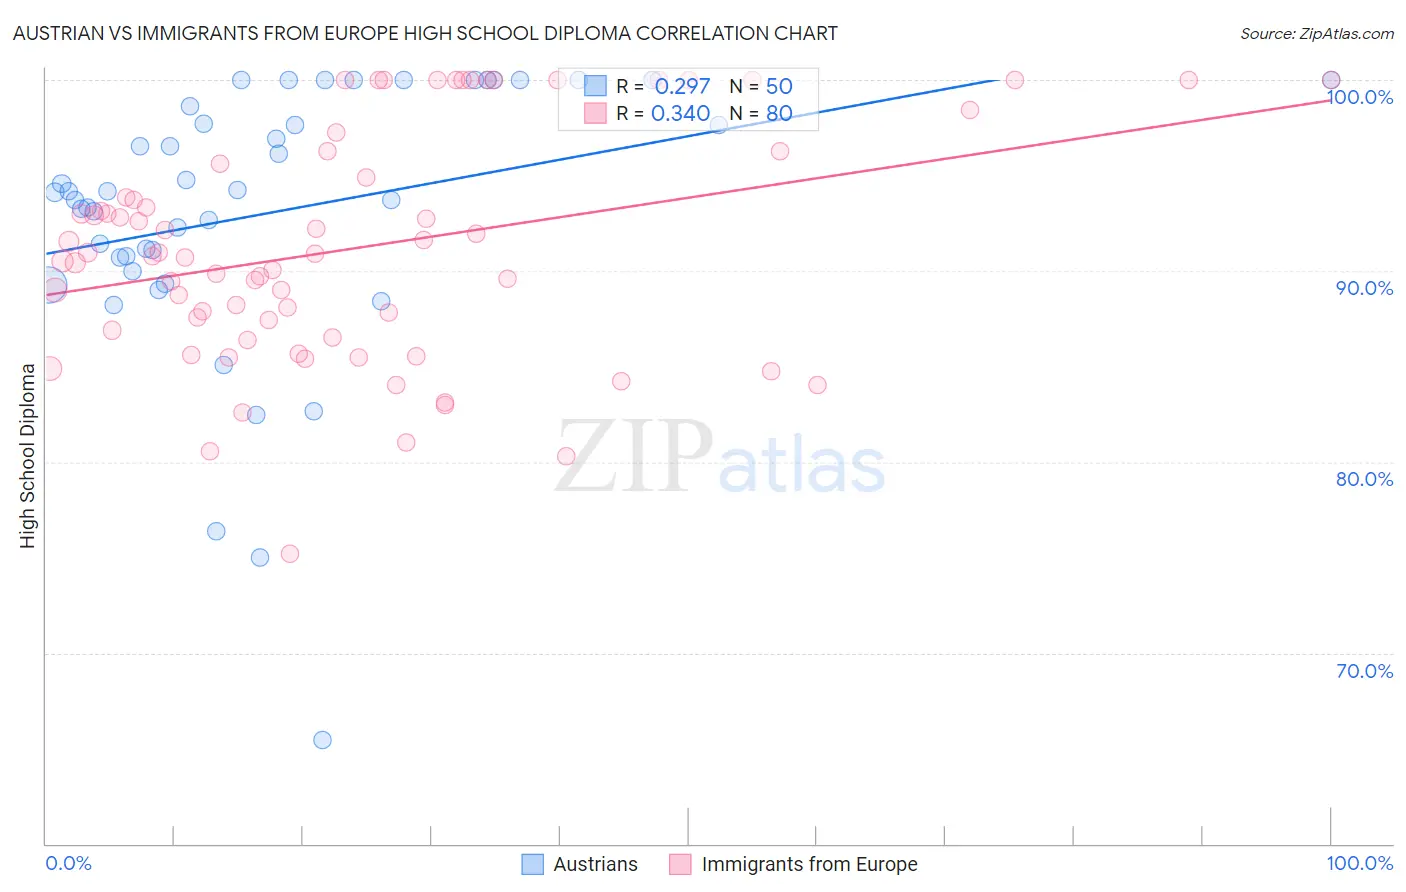
Austrian vs Immigrants from Europe High School Diploma Correlation Chart

The statistical analysis conducted on geographies consisting of 452,082,614 people shows a weak positive correlation between the proportion of Austrians and percentage of population with at least high school diploma education in the United States with a correlation coefficient (R) of 0.297 and weighted average of 91.0%. Similarly, the statistical analysis conducted on geographies consisting of 547,425,973 people shows a mild positive correlation between the proportion of Immigrants from Europe and percentage of population with at least high school diploma education in the United States with a correlation coefficient (R) of 0.340 and weighted average of 90.5%, a difference of 0.56%.
Austrian vs Immigrants from Europe High School Diploma

High School Diploma Correlation Summary

MeasurementAustrianImmigrants from Europe
Minimum65.4%75.2%
Maximum100.0%100.0%
Range34.6%24.8%
Mean93.0%91.2%
Median94.1%90.8%
Interquartile 25% (IQ1)90.7%86.7%
Interquartile 75% (IQ3)98.6%95.9%
Interquartile Range (IQR)7.9%9.2%
Standard Deviation (Sample)7.2%6.0%
Standard Deviation (Population)7.1%6.0%

Similar Demographics by High School Diploma

Demographics Similar to Austrians by High School Diploma

In terms of high school diploma, the demographic groups most similar to Austrians are Immigrants from Taiwan (91.0%, a difference of 0.020%), Immigrants from Japan (91.0%, a difference of 0.030%), Immigrants from Netherlands (91.0%, a difference of 0.030%), Ukrainian (91.0%, a difference of 0.030%), and Immigrants from South Africa (91.0%, a difference of 0.040%).
DemographicsRating | RankHigh School Diploma
Serbians
99.7
/100
|
#55
Exceptional
91.1%
Immigrants | Canada
99.7
/100
|
#56
Exceptional
91.1%
Zimbabweans
99.7
/100
|
#57
Exceptional
91.1%
Slavs
99.7
/100
|
#58
Exceptional
91.0%
Immigrants | North America
99.7
/100
|
#59
Exceptional
91.0%
Immigrants | Japan
99.6
/100
|
#60
Exceptional
91.0%
Immigrants | Taiwan
99.6
/100
|
#61
Exceptional
91.0%
Austrians
99.6
/100
|
#62
Exceptional
91.0%
Immigrants | Netherlands
99.6
/100
|
#63
Exceptional
91.0%
Ukrainians
99.6
/100
|
#64
Exceptional
91.0%
Immigrants | South Africa
99.6
/100
|
#65
Exceptional
91.0%
French
99.5
/100
|
#66
Exceptional
91.0%
Immigrants | Iran
99.5
/100
|
#67
Exceptional
90.9%
Czechoslovakians
99.5
/100
|
#68
Exceptional
90.9%
French Canadians
99.5
/100
|
#69
Exceptional
90.9%

Demographics Similar to Immigrants from Europe by High School Diploma

In terms of high school diploma, the demographic groups most similar to Immigrants from Europe are Immigrants from North Macedonia (90.5%, a difference of 0.010%), Immigrants from Kuwait (90.5%, a difference of 0.020%), Immigrants from Korea (90.5%, a difference of 0.020%), Immigrants from Norway (90.5%, a difference of 0.030%), and Aleut (90.4%, a difference of 0.040%).
DemographicsRating | RankHigh School Diploma
Swiss
98.6
/100
|
#92
Exceptional
90.6%
Immigrants | Western Europe
98.6
/100
|
#93
Exceptional
90.6%
Immigrants | Israel
98.5
/100
|
#94
Exceptional
90.5%
Icelanders
98.5
/100
|
#95
Exceptional
90.5%
Immigrants | Serbia
98.4
/100
|
#96
Exceptional
90.5%
Immigrants | Kuwait
98.3
/100
|
#97
Exceptional
90.5%
Immigrants | Korea
98.3
/100
|
#98
Exceptional
90.5%
Immigrants | Europe
98.2
/100
|
#99
Exceptional
90.5%
Immigrants | North Macedonia
98.1
/100
|
#100
Exceptional
90.5%
Immigrants | Norway
98.0
/100
|
#101
Exceptional
90.5%
Aleuts
98.0
/100
|
#102
Exceptional
90.4%
Immigrants | Romania
97.8
/100
|
#103
Exceptional
90.4%
Immigrants | Croatia
97.8
/100
|
#104
Exceptional
90.4%
Lebanese
97.4
/100
|
#105
Exceptional
90.4%
Syrians
97.0
/100
|
#106
Exceptional
90.3%