Austrian vs Immigrants from Congo 12th Grade, No Diploma

COMPARE

Austrian
Race
Ancestry
AfghanAfricanAlaska NativeAlaskan AthabascanAlbanianAleutAlsatianAmericanApacheArabArapahoArgentineanArmenianAssyrian/Chaldean/SyriacAustralianAustrianBahamianBangladeshiBarbadianBasqueBelgianBelizeanBermudanBhutaneseBlackfeetBolivianBrazilianBritishBritish West IndianBulgarianBurmeseCajunCambodianCanadianCape VerdeanCarpatho RusynCelticCentral AmericanCentral American IndianCherokeeCheyenneChickasawChileanChineseChippewaChoctawColombianColvilleComancheCosta RicanCreeCreekCroatianCrowCubanCypriotCzechCzechoslovakianDanishDelawareDominicanDutchDutch West IndianEastern EuropeanEcuadorianEgyptianEnglishEstonianEthiopianEuropeanFijianFilipinoFinnishFrenchFrench American IndianFrench CanadianGermanGerman RussianGhanaianGreekGuamanian/ChamorroGuatemalanGuyaneseHaitianHmongHonduranHopiHoumaHungarianIcelanderIndian (Asian)IndonesianInupiatIranianIraqiIrishIroquoisIsraeliItalianJamaicanJapaneseJordanianKenyanKiowaKoreanLaotianLatvianLebaneseLiberianLithuanianLumbeeLuxembourgerMacedonianMalaysianMalteseMarshalleseMenomineeMexicanMexican American IndianMongolianMoroccanNative HawaiianNavajoNepaleseNew ZealanderNicaraguanNigerianNorthern EuropeanNorwegianOkinawanOsageOttawaPaiutePakistaniPalestinianPanamanianParaguayanPennsylvania GermanPeruvianPimaPolishPortuguesePotawatomiPuebloPuerto RicanPuget Sound SalishRomanianRussianSalvadoranSamoanScandinavianScotch-IrishScottishSeminoleSenegaleseSerbianShoshoneSierra LeoneanSiouxSlavicSlovakSloveneSomaliSouth AfricanSouth AmericanSouth American IndianSoviet UnionSpaniardSpanishSpanish AmericanSpanish American IndianSri LankanSubsaharan AfricanSudaneseSwedishSwissSyrianTaiwaneseThaiTlingit-HaidaTohono O'OdhamTonganTrinidadian and TobagonianTsimshianTurkishU.S. Virgin IslanderUgandanUkrainianUruguayanUteVenezuelanVietnameseWelshWest IndianYakamaYaquiYugoslavianYumanYup'ikZimbabwean
Immigration
NonimmigrantsImmigrantsAfghanistanAfricaAlbaniaArgentinaArmeniaAsiaAustraliaAustriaBahamasBangladeshBarbadosBelarusBelgiumBelizeBoliviaBosnia and HerzegovinaBrazilBulgariaBurma/MyanmarCabo VerdeCambodiaCameroonCanadaCaribbeanCentral AmericaChileChinaColombiaCosta RicaCroatiaCubaCzechoslovakiaDenmarkDominicaDominican RepublicEastern AfricaEastern AsiaEastern EuropeEcuadorEgyptEl SalvadorEnglandEritreaEthiopiaEuropeFijiFranceGermanyGhanaGreeceGrenadaGuatemalaGuyanaHaitiHondurasHong KongHungaryIndiaIndonesiaIranIraqIrelandIsraelItalyJamaicaJapanJordanKazakhstanKenyaKoreaKuwaitLaosLatin AmericaLatviaLebanonLiberiaLithuaniaMalaysiaMexicoMicronesiaMiddle AfricaMoldovaMoroccoNepalNetherlandsNicaraguaNigeriaNorth AmericaNorth MacedoniaNorthern AfricaNorthern EuropeNorwayOceaniaPakistanPanamaPeruPhilippinesPolandPortugalRomaniaRussiaSaudi ArabiaScotlandSenegalSerbiaSierra LeoneSingaporeSomaliaSouth AfricaSouth AmericaSouth Central AsiaSouth Eastern AsiaSouthern EuropeSpainSri LankaSt. Vincent and the GrenadinesSudanSwedenSwitzerlandSyriaTaiwanThailandTrinidad and TobagoTurkeyUgandaUkraineUruguayUzbekistanVenezuelaVietnamWest IndiesWestern AfricaWestern AsiaWestern EuropeYemenZaireZimbabweAzores
Immigrants from Congo
Race
Ancestry
AfghanAfricanAlaska NativeAlaskan AthabascanAlbanianAleutAlsatianAmericanApacheArabArapahoArgentineanArmenianAssyrian/Chaldean/SyriacAustralianBahamianBangladeshiBarbadianBasqueBelgianBelizeanBermudanBhutaneseBlackfeetBolivianBrazilianBritishBritish West IndianBulgarianBurmeseCajunCambodianCanadianCape VerdeanCarpatho RusynCelticCentral AmericanCentral American IndianCherokeeCheyenneChickasawChileanChineseChippewaChoctawColombianColvilleComancheCosta RicanCreeCreekCroatianCrowCubanCypriotCzechCzechoslovakianDanishDelawareDominicanDutchDutch West IndianEastern EuropeanEcuadorianEgyptianEnglishEstonianEthiopianEuropeanFijianFilipinoFinnishFrenchFrench American IndianFrench CanadianGermanGerman RussianGhanaianGreekGuamanian/ChamorroGuatemalanGuyaneseHaitianHmongHonduranHopiHoumaHungarianIcelanderIndian (Asian)IndonesianInupiatIranianIraqiIrishIroquoisIsraeliItalianJamaicanJapaneseJordanianKenyanKiowaKoreanLaotianLatvianLebaneseLiberianLithuanianLumbeeLuxembourgerMacedonianMalaysianMalteseMarshalleseMenomineeMexicanMexican American IndianMongolianMoroccanNative HawaiianNavajoNepaleseNew ZealanderNicaraguanNigerianNorthern EuropeanNorwegianOkinawanOsageOttawaPaiutePakistaniPalestinianPanamanianParaguayanPennsylvania GermanPeruvianPimaPolishPortuguesePotawatomiPuebloPuerto RicanPuget Sound SalishRomanianRussianSalvadoranSamoanScandinavianScotch-IrishScottishSeminoleSenegaleseSerbianShoshoneSierra LeoneanSiouxSlavicSlovakSloveneSomaliSouth AfricanSouth AmericanSouth American IndianSoviet UnionSpaniardSpanishSpanish AmericanSpanish American IndianSri LankanSubsaharan AfricanSudaneseSwedishSwissSyrianTaiwaneseThaiTlingit-HaidaTohono O'OdhamTonganTrinidadian and TobagonianTsimshianTurkishU.S. Virgin IslanderUgandanUkrainianUruguayanUteVenezuelanVietnameseWelshWest IndianYakamaYaquiYugoslavianYumanYup'ikZimbabwean
Immigration
NonimmigrantsImmigrantsAfghanistanAfricaAlbaniaArgentinaArmeniaAsiaAustraliaAustriaBahamasBangladeshBarbadosBelarusBelgiumBelizeBoliviaBosnia and HerzegovinaBrazilBulgariaBurma/MyanmarCabo VerdeCambodiaCameroonCanadaCaribbeanCentral AmericaChileChinaColombiaCongoCosta RicaCroatiaCubaCzechoslovakiaDenmarkDominicaDominican RepublicEastern AfricaEastern AsiaEastern EuropeEcuadorEgyptEl SalvadorEnglandEritreaEthiopiaEuropeFijiFranceGermanyGhanaGreeceGrenadaGuatemalaGuyanaHaitiHondurasHong KongHungaryIndiaIndonesiaIranIraqIrelandIsraelItalyJamaicaJapanJordanKazakhstanKenyaKoreaKuwaitLaosLatin AmericaLatviaLebanonLiberiaLithuaniaMalaysiaMexicoMicronesiaMiddle AfricaMoldovaMoroccoNepalNetherlandsNicaraguaNigeriaNorth AmericaNorth MacedoniaNorthern AfricaNorthern EuropeNorwayOceaniaPakistanPanamaPeruPhilippinesPolandPortugalRomaniaRussiaSaudi ArabiaScotlandSenegalSerbiaSierra LeoneSingaporeSomaliaSouth AfricaSouth AmericaSouth Central AsiaSouth Eastern AsiaSouthern EuropeSpainSri LankaSt. Vincent and the GrenadinesSudanSwedenSwitzerlandSyriaTaiwanThailandTrinidad and TobagoTurkeyUgandaUkraineUruguayUzbekistanVenezuelaVietnamWest IndiesWestern AfricaWestern AsiaWestern EuropeYemenZaireZimbabweAzores
12th Grade, No Diploma
Income
Poverty
Unemployment
Labor Participation
Family Structure
Vehicle Availability
Education Level
Disability

12th Grade, No Diploma Comparison

Austrians

Immigrants from Congo

Exceptional
Tragic
92.7%
12TH GRADE, NO DIPLOMA
99.6/ 100
METRIC RATING
65th/ 347
METRIC RANK
89.0%
12TH GRADE, NO DIPLOMA
0.1/ 100
METRIC RATING
275th/ 347
METRIC RANK

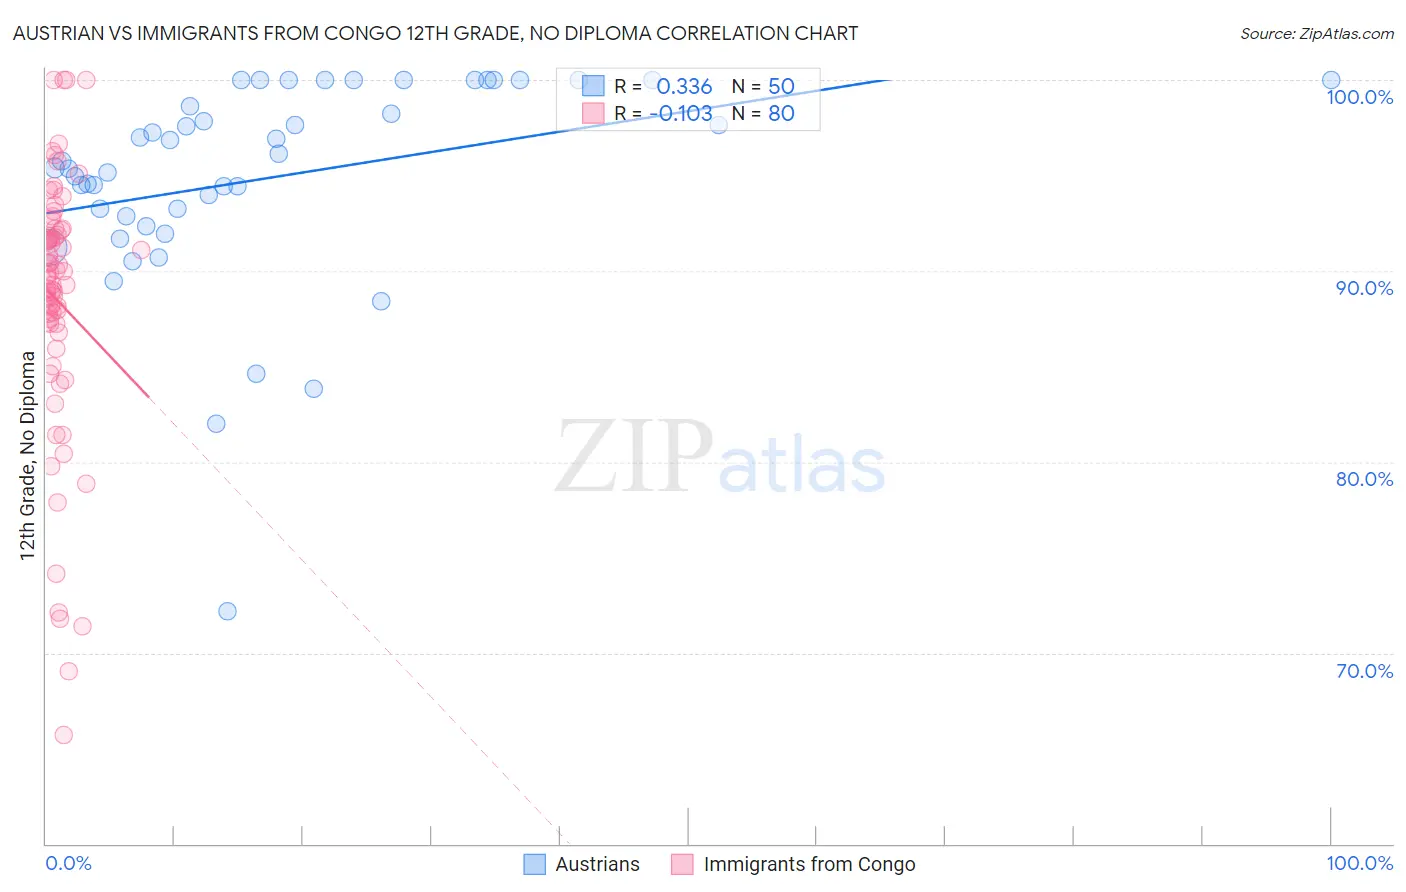
Austrian vs Immigrants from Congo 12th Grade, No Diploma Correlation Chart

The statistical analysis conducted on geographies consisting of 452,082,820 people shows a mild positive correlation between the proportion of Austrians and percentage of population with at least 12th grade (no diploma) education in the United States with a correlation coefficient (R) of 0.336 and weighted average of 92.7%. Similarly, the statistical analysis conducted on geographies consisting of 92,134,351 people shows a poor negative correlation between the proportion of Immigrants from Congo and percentage of population with at least 12th grade (no diploma) education in the United States with a correlation coefficient (R) of -0.103 and weighted average of 89.0%, a difference of 4.1%.
Austrian vs Immigrants from Congo 12th Grade, No Diploma

12th Grade, No Diploma Correlation Summary

MeasurementAustrianImmigrants from Congo
Minimum72.2%65.7%
Maximum100.0%100.0%
Range27.8%34.3%
Mean94.9%88.5%
Median95.6%89.7%
Interquartile 25% (IQ1)92.9%87.2%
Interquartile 75% (IQ3)100.0%92.0%
Interquartile Range (IQR)7.1%4.8%
Standard Deviation (Sample)5.5%6.8%
Standard Deviation (Population)5.4%6.8%

Similar Demographics by 12th Grade, No Diploma

Demographics Similar to Austrians by 12th Grade, No Diploma

In terms of 12th grade, no diploma, the demographic groups most similar to Austrians are Immigrants from Netherlands (92.7%, a difference of 0.0%), Zimbabwean (92.7%, a difference of 0.010%), Ukrainian (92.7%, a difference of 0.030%), Soviet Union (92.7%, a difference of 0.030%), and Immigrants from Japan (92.8%, a difference of 0.050%).
DemographicsRating | Rank12th Grade, No Diploma
Immigrants | Taiwan
99.7
/100
|
#58
Exceptional
92.8%
Immigrants | North America
99.7
/100
|
#59
Exceptional
92.8%
Slavs
99.7
/100
|
#60
Exceptional
92.8%
Immigrants | Japan
99.7
/100
|
#61
Exceptional
92.8%
Ukrainians
99.6
/100
|
#62
Exceptional
92.7%
Zimbabweans
99.6
/100
|
#63
Exceptional
92.7%
Immigrants | Netherlands
99.6
/100
|
#64
Exceptional
92.7%
Austrians
99.6
/100
|
#65
Exceptional
92.7%
Soviet Union
99.6
/100
|
#66
Exceptional
92.7%
Immigrants | South Africa
99.5
/100
|
#67
Exceptional
92.7%
Immigrants | Czechoslovakia
99.5
/100
|
#68
Exceptional
92.7%
Immigrants | Iran
99.5
/100
|
#69
Exceptional
92.7%
Czechoslovakians
99.5
/100
|
#70
Exceptional
92.6%
Immigrants | Latvia
99.5
/100
|
#71
Exceptional
92.6%
Immigrants | South Central Asia
99.5
/100
|
#72
Exceptional
92.6%

Demographics Similar to Immigrants from Congo by 12th Grade, No Diploma

In terms of 12th grade, no diploma, the demographic groups most similar to Immigrants from Congo are Ute (89.0%, a difference of 0.0%), Immigrants from Barbados (89.0%, a difference of 0.060%), Cajun (89.1%, a difference of 0.070%), Barbadian (89.1%, a difference of 0.090%), and Immigrants from St. Vincent and the Grenadines (88.9%, a difference of 0.12%).
DemographicsRating | Rank12th Grade, No Diploma
Immigrants | Trinidad and Tobago
0.1
/100
|
#268
Tragic
89.3%
U.S. Virgin Islanders
0.1
/100
|
#269
Tragic
89.3%
Bangladeshis
0.1
/100
|
#270
Tragic
89.3%
Blacks/African Americans
0.1
/100
|
#271
Tragic
89.3%
Malaysians
0.1
/100
|
#272
Tragic
89.2%
Barbadians
0.1
/100
|
#273
Tragic
89.1%
Cajuns
0.1
/100
|
#274
Tragic
89.1%
Immigrants | Congo
0.1
/100
|
#275
Tragic
89.0%
Ute
0.1
/100
|
#276
Tragic
89.0%
Immigrants | Barbados
0.0
/100
|
#277
Tragic
89.0%
Immigrants | St. Vincent and the Grenadines
0.0
/100
|
#278
Tragic
88.9%
Immigrants | Laos
0.0
/100
|
#279
Tragic
88.9%
Immigrants | Burma/Myanmar
0.0
/100
|
#280
Tragic
88.9%
Cubans
0.0
/100
|
#281
Tragic
88.9%
Immigrants | Vietnam
0.0
/100
|
#282
Tragic
88.7%