Austrian vs Immigrants from Argentina Kindergarten

COMPARE

Austrian
Race
Ancestry
AfghanAfricanAlaska NativeAlaskan AthabascanAlbanianAleutAlsatianAmericanApacheArabArapahoArgentineanArmenianAssyrian/Chaldean/SyriacAustralianAustrianBahamianBangladeshiBarbadianBasqueBelgianBelizeanBermudanBhutaneseBlackfeetBolivianBrazilianBritishBritish West IndianBulgarianBurmeseCajunCambodianCanadianCape VerdeanCarpatho RusynCelticCentral AmericanCentral American IndianCherokeeCheyenneChickasawChileanChineseChippewaChoctawColombianColvilleComancheCosta RicanCreeCreekCroatianCrowCubanCypriotCzechCzechoslovakianDanishDelawareDominicanDutchDutch West IndianEastern EuropeanEcuadorianEgyptianEnglishEstonianEthiopianEuropeanFijianFilipinoFinnishFrenchFrench American IndianFrench CanadianGermanGerman RussianGhanaianGreekGuamanian/ChamorroGuatemalanGuyaneseHaitianHmongHonduranHopiHoumaHungarianIcelanderIndian (Asian)IndonesianInupiatIranianIraqiIrishIroquoisIsraeliItalianJamaicanJapaneseJordanianKenyanKiowaKoreanLaotianLatvianLebaneseLiberianLithuanianLumbeeLuxembourgerMacedonianMalaysianMalteseMarshalleseMenomineeMexicanMexican American IndianMongolianMoroccanNative HawaiianNavajoNepaleseNew ZealanderNicaraguanNigerianNorthern EuropeanNorwegianOkinawanOsageOttawaPaiutePakistaniPalestinianPanamanianParaguayanPennsylvania GermanPeruvianPimaPolishPortuguesePotawatomiPuebloPuerto RicanPuget Sound SalishRomanianRussianSalvadoranSamoanScandinavianScotch-IrishScottishSeminoleSenegaleseSerbianShoshoneSierra LeoneanSiouxSlavicSlovakSloveneSomaliSouth AfricanSouth AmericanSouth American IndianSoviet UnionSpaniardSpanishSpanish AmericanSpanish American IndianSri LankanSubsaharan AfricanSudaneseSwedishSwissSyrianTaiwaneseThaiTlingit-HaidaTohono O'OdhamTonganTrinidadian and TobagonianTsimshianTurkishU.S. Virgin IslanderUgandanUkrainianUruguayanUteVenezuelanVietnameseWelshWest IndianYakamaYaquiYugoslavianYumanYup'ikZimbabwean
Immigration
NonimmigrantsImmigrantsAfghanistanAfricaAlbaniaArmeniaAsiaAustraliaAustriaBahamasBangladeshBarbadosBelarusBelgiumBelizeBoliviaBosnia and HerzegovinaBrazilBulgariaBurma/MyanmarCabo VerdeCambodiaCameroonCanadaCaribbeanCentral AmericaChileChinaColombiaCongoCosta RicaCroatiaCubaCzechoslovakiaDenmarkDominicaDominican RepublicEastern AfricaEastern AsiaEastern EuropeEcuadorEgyptEl SalvadorEnglandEritreaEthiopiaEuropeFijiFranceGermanyGhanaGreeceGrenadaGuatemalaGuyanaHaitiHondurasHong KongHungaryIndiaIndonesiaIranIraqIrelandIsraelItalyJamaicaJapanJordanKazakhstanKenyaKoreaKuwaitLaosLatin AmericaLatviaLebanonLiberiaLithuaniaMalaysiaMexicoMicronesiaMiddle AfricaMoldovaMoroccoNepalNetherlandsNicaraguaNigeriaNorth AmericaNorth MacedoniaNorthern AfricaNorthern EuropeNorwayOceaniaPakistanPanamaPeruPhilippinesPolandPortugalRomaniaRussiaSaudi ArabiaScotlandSenegalSerbiaSierra LeoneSingaporeSomaliaSouth AfricaSouth AmericaSouth Central AsiaSouth Eastern AsiaSouthern EuropeSpainSri LankaSt. Vincent and the GrenadinesSudanSwedenSwitzerlandSyriaTaiwanThailandTrinidad and TobagoTurkeyUgandaUkraineUruguayUzbekistanVenezuelaVietnamWest IndiesWestern AfricaWestern AsiaWestern EuropeYemenZaireZimbabweAzores
Immigrants from Argentina
Race
Ancestry
AfghanAfricanAlaska NativeAlaskan AthabascanAlbanianAleutAlsatianAmericanApacheArabArapahoArgentineanArmenianAssyrian/Chaldean/SyriacAustralianBahamianBangladeshiBarbadianBasqueBelgianBelizeanBermudanBhutaneseBlackfeetBolivianBrazilianBritishBritish West IndianBulgarianBurmeseCajunCambodianCanadianCape VerdeanCarpatho RusynCelticCentral AmericanCentral American IndianCherokeeCheyenneChickasawChileanChineseChippewaChoctawColombianColvilleComancheCosta RicanCreeCreekCroatianCrowCubanCypriotCzechCzechoslovakianDanishDelawareDominicanDutchDutch West IndianEastern EuropeanEcuadorianEgyptianEnglishEstonianEthiopianEuropeanFijianFilipinoFinnishFrenchFrench American IndianFrench CanadianGermanGerman RussianGhanaianGreekGuamanian/ChamorroGuatemalanGuyaneseHaitianHmongHonduranHopiHoumaHungarianIcelanderIndian (Asian)IndonesianInupiatIranianIraqiIrishIroquoisIsraeliItalianJamaicanJapaneseJordanianKenyanKiowaKoreanLaotianLatvianLebaneseLiberianLithuanianLumbeeLuxembourgerMacedonianMalaysianMalteseMarshalleseMenomineeMexicanMexican American IndianMongolianMoroccanNative HawaiianNavajoNepaleseNew ZealanderNicaraguanNigerianNorthern EuropeanNorwegianOkinawanOsageOttawaPaiutePakistaniPalestinianPanamanianParaguayanPennsylvania GermanPeruvianPimaPolishPortuguesePotawatomiPuebloPuerto RicanPuget Sound SalishRomanianRussianSalvadoranSamoanScandinavianScotch-IrishScottishSeminoleSenegaleseSerbianShoshoneSierra LeoneanSiouxSlavicSlovakSloveneSomaliSouth AfricanSouth AmericanSouth American IndianSoviet UnionSpaniardSpanishSpanish AmericanSpanish American IndianSri LankanSubsaharan AfricanSudaneseSwedishSwissSyrianTaiwaneseThaiTlingit-HaidaTohono O'OdhamTonganTrinidadian and TobagonianTsimshianTurkishU.S. Virgin IslanderUgandanUkrainianUruguayanUteVenezuelanVietnameseWelshWest IndianYakamaYaquiYugoslavianYumanYup'ikZimbabwean
Immigration
NonimmigrantsImmigrantsAfghanistanAfricaAlbaniaArgentinaArmeniaAsiaAustraliaAustriaBahamasBangladeshBarbadosBelarusBelgiumBelizeBoliviaBosnia and HerzegovinaBrazilBulgariaBurma/MyanmarCabo VerdeCambodiaCameroonCanadaCaribbeanCentral AmericaChileChinaColombiaCongoCosta RicaCroatiaCubaCzechoslovakiaDenmarkDominicaDominican RepublicEastern AfricaEastern AsiaEastern EuropeEcuadorEgyptEl SalvadorEnglandEritreaEthiopiaEuropeFijiFranceGermanyGhanaGreeceGrenadaGuatemalaGuyanaHaitiHondurasHong KongHungaryIndiaIndonesiaIranIraqIrelandIsraelItalyJamaicaJapanJordanKazakhstanKenyaKoreaKuwaitLaosLatin AmericaLatviaLebanonLiberiaLithuaniaMalaysiaMexicoMicronesiaMiddle AfricaMoldovaMoroccoNepalNetherlandsNicaraguaNigeriaNorth AmericaNorth MacedoniaNorthern AfricaNorthern EuropeNorwayOceaniaPakistanPanamaPeruPhilippinesPolandPortugalRomaniaRussiaSaudi ArabiaScotlandSenegalSerbiaSierra LeoneSingaporeSomaliaSouth AfricaSouth AmericaSouth Central AsiaSouth Eastern AsiaSouthern EuropeSpainSri LankaSt. Vincent and the GrenadinesSudanSwedenSwitzerlandSyriaTaiwanThailandTrinidad and TobagoTurkeyUgandaUkraineUruguayUzbekistanVenezuelaVietnamWest IndiesWestern AfricaWestern AsiaWestern EuropeYemenZaireZimbabweAzores
Kindergarten
Income
Poverty
Unemployment
Labor Participation
Family Structure
Vehicle Availability
Education Level
Disability

Kindergarten Comparison

Austrians

Immigrants from Argentina

Exceptional
Average
98.4%
KINDERGARTEN
99.8/ 100
METRIC RATING
57th/ 347
METRIC RANK
97.9%
KINDERGARTEN
40.7/ 100
METRIC RATING
184th/ 347
METRIC RANK

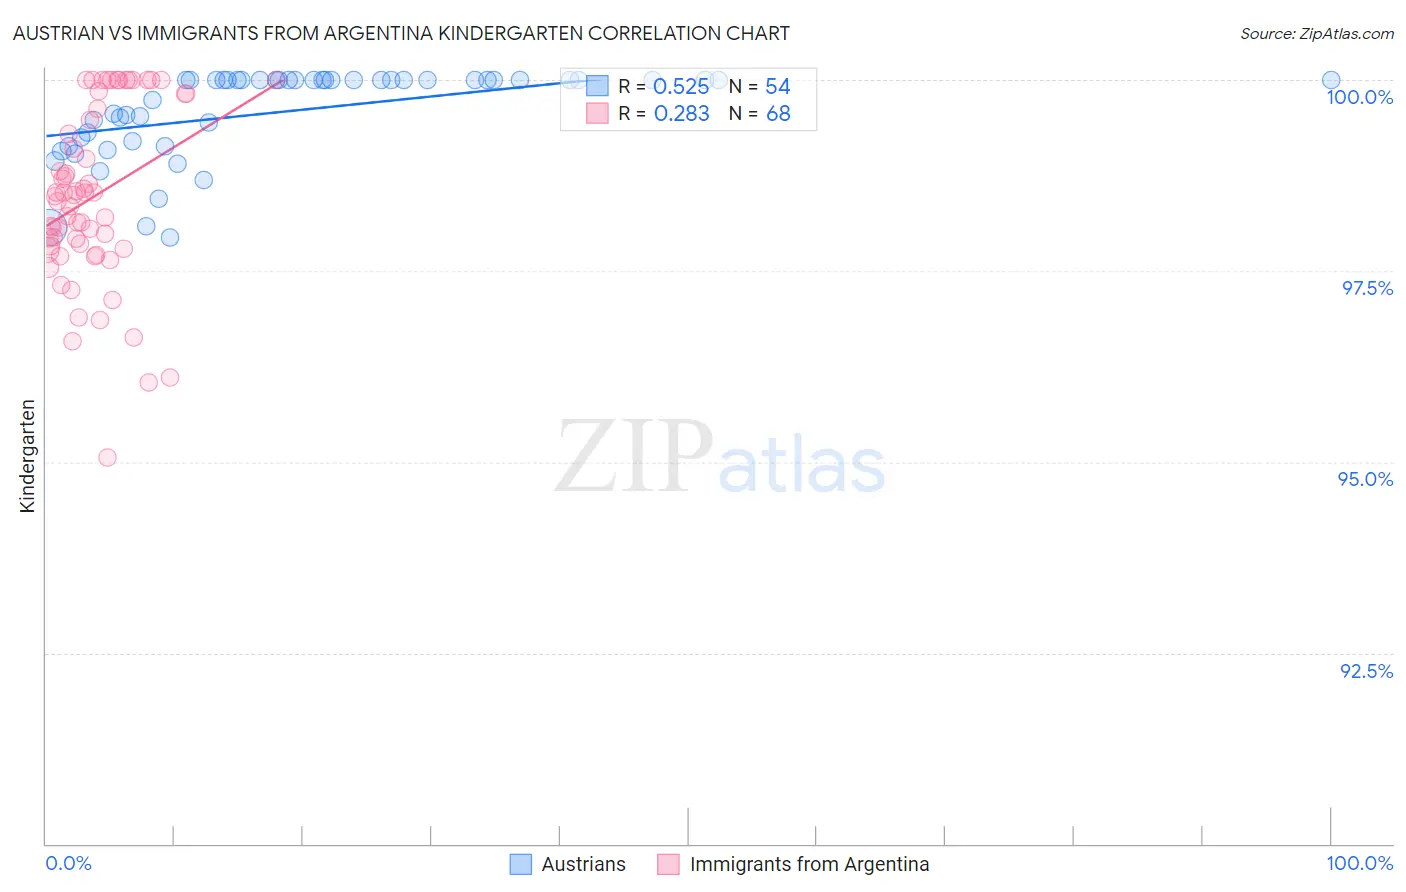
Austrian vs Immigrants from Argentina Kindergarten Correlation Chart

The statistical analysis conducted on geographies consisting of 452,080,536 people shows a substantial positive correlation between the proportion of Austrians and percentage of population with at least kindergarten education in the United States with a correlation coefficient (R) of 0.525 and weighted average of 98.4%. Similarly, the statistical analysis conducted on geographies consisting of 264,435,492 people shows a weak positive correlation between the proportion of Immigrants from Argentina and percentage of population with at least kindergarten education in the United States with a correlation coefficient (R) of 0.283 and weighted average of 97.9%, a difference of 0.49%.
Austrian vs Immigrants from Argentina Kindergarten

Kindergarten Correlation Summary

MeasurementAustrianImmigrants from Argentina
Minimum97.9%95.1%
Maximum100.0%100.0%
Range2.1%4.9%
Mean99.6%98.5%
Median100.0%98.5%
Interquartile 25% (IQ1)99.2%97.8%
Interquartile 75% (IQ3)100.0%99.7%
Interquartile Range (IQR)0.81%1.9%
Standard Deviation (Sample)0.58%1.2%
Standard Deviation (Population)0.57%1.1%

Similar Demographics by Kindergarten

Demographics Similar to Austrians by Kindergarten

In terms of kindergarten, the demographic groups most similar to Austrians are American (98.4%, a difference of 0.0%), Bulgarian (98.4%, a difference of 0.0%), Immigrants from Scotland (98.4%, a difference of 0.010%), Immigrants from Canada (98.4%, a difference of 0.010%), and Creek (98.4%, a difference of 0.010%).
DemographicsRating | RankKindergarten
Whites/Caucasians
99.8
/100
|
#50
Exceptional
98.4%
Estonians
99.8
/100
|
#51
Exceptional
98.4%
Australians
99.8
/100
|
#52
Exceptional
98.4%
Celtics
99.8
/100
|
#53
Exceptional
98.4%
Pueblo
99.8
/100
|
#54
Exceptional
98.4%
Immigrants | Scotland
99.8
/100
|
#55
Exceptional
98.4%
Americans
99.8
/100
|
#56
Exceptional
98.4%
Austrians
99.8
/100
|
#57
Exceptional
98.4%
Bulgarians
99.7
/100
|
#58
Exceptional
98.4%
Immigrants | Canada
99.7
/100
|
#59
Exceptional
98.4%
Creek
99.7
/100
|
#60
Exceptional
98.4%
Slavs
99.7
/100
|
#61
Exceptional
98.4%
New Zealanders
99.7
/100
|
#62
Exceptional
98.4%
Immigrants | North America
99.7
/100
|
#63
Exceptional
98.4%
Greeks
99.7
/100
|
#64
Exceptional
98.4%

Demographics Similar to Immigrants from Argentina by Kindergarten

In terms of kindergarten, the demographic groups most similar to Immigrants from Argentina are Immigrants from Poland (97.9%, a difference of 0.0%), Immigrants from Belarus (97.9%, a difference of 0.0%), Portuguese (97.9%, a difference of 0.010%), Egyptian (97.9%, a difference of 0.010%), and Immigrants from Venezuela (97.9%, a difference of 0.020%).
DemographicsRating | RankKindergarten
Immigrants | Venezuela
47.9
/100
|
#177
Average
97.9%
Brazilians
47.6
/100
|
#178
Average
97.9%
Argentineans
46.8
/100
|
#179
Average
97.9%
Immigrants | Bosnia and Herzegovina
46.7
/100
|
#180
Average
97.9%
Portuguese
43.5
/100
|
#181
Average
97.9%
Egyptians
42.4
/100
|
#182
Average
97.9%
Immigrants | Poland
41.4
/100
|
#183
Average
97.9%
Immigrants | Argentina
40.7
/100
|
#184
Average
97.9%
Immigrants | Belarus
39.4
/100
|
#185
Fair
97.9%
Pakistanis
36.0
/100
|
#186
Fair
97.9%
Immigrants | Kazakhstan
35.9
/100
|
#187
Fair
97.9%
Arabs
35.4
/100
|
#188
Fair
97.9%
Paiute
34.7
/100
|
#189
Fair
97.9%
Panamanians
33.3
/100
|
#190
Fair
97.9%
Immigrants | Taiwan
30.7
/100
|
#191
Fair
97.9%