Asian vs Tlingit-Haida Professional Degree
COMPARE
Asian
Tlingit-Haida
Professional Degree
Professional Degree Comparison
Asians
Tlingit-Haida
5.5%
PROFESSIONAL DEGREE
99.9/ 100
METRIC RATING
63rd/ 347
METRIC RANK
4.0%
PROFESSIONAL DEGREE
6.9/ 100
METRIC RATING
225th/ 347
METRIC RANK
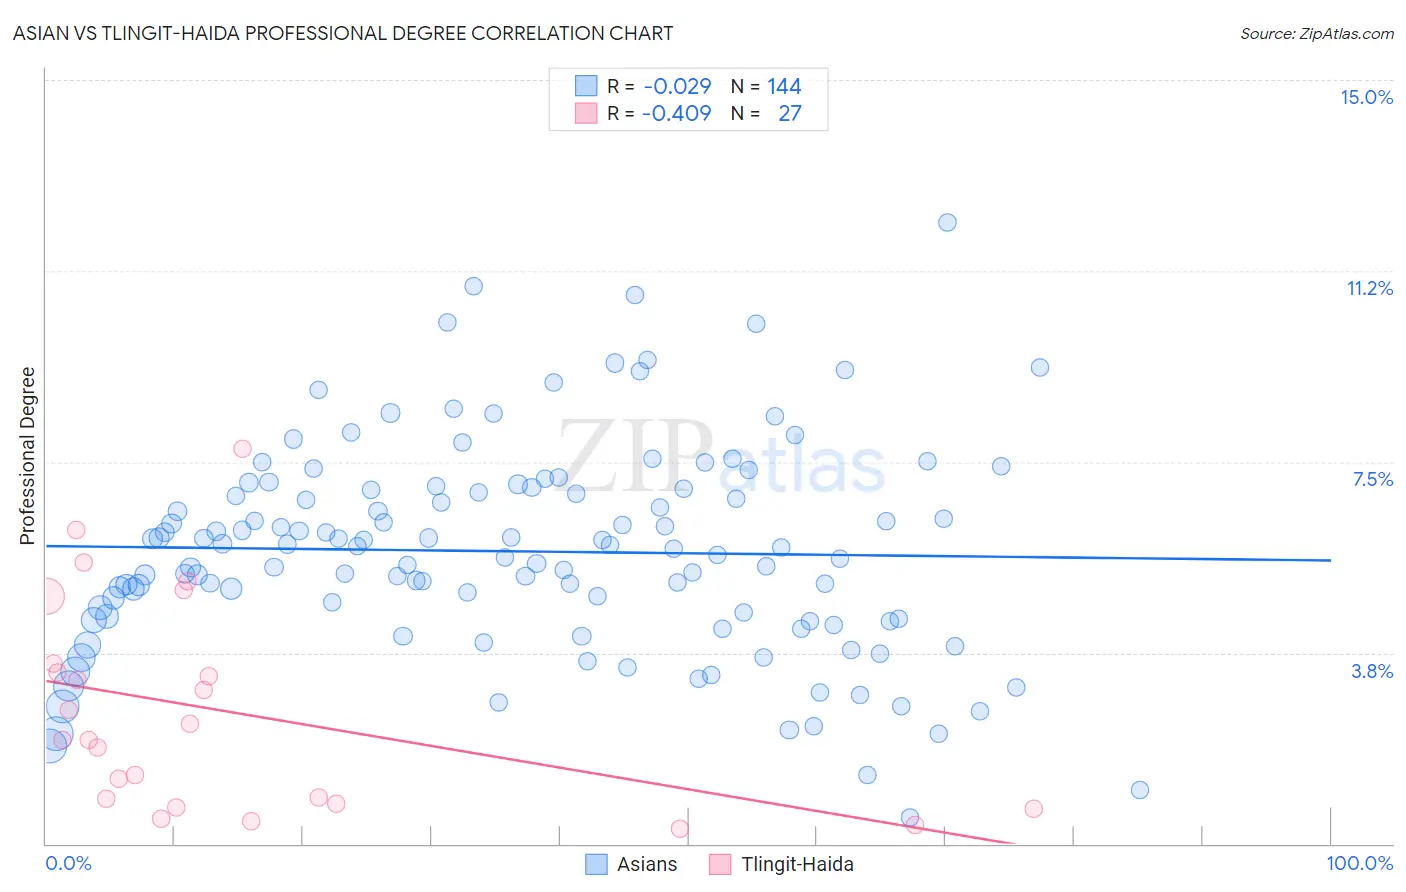
Asian vs Tlingit-Haida Professional Degree Correlation Chart
The statistical analysis conducted on geographies consisting of 546,309,051 people shows no correlation between the proportion of Asians and percentage of population with at least professional degree education in the United States with a correlation coefficient (R) of -0.029 and weighted average of 5.5%. Similarly, the statistical analysis conducted on geographies consisting of 60,804,228 people shows a moderate negative correlation between the proportion of Tlingit-Haida and percentage of population with at least professional degree education in the United States with a correlation coefficient (R) of -0.409 and weighted average of 4.0%, a difference of 38.1%.
Professional Degree Correlation Summary
| Measurement | Asian | Tlingit-Haida |
| Minimum | 0.52% | 0.29% |
| Maximum | 12.2% | 7.8% |
| Range | 11.7% | 7.5% |
| Mean | 5.7% | 2.6% |
| Median | 5.8% | 2.0% |
| Interquartile 25% (IQ1) | 4.4% | 0.79% |
| Interquartile 75% (IQ3) | 7.0% | 3.5% |
| Interquartile Range (IQR) | 2.6% | 2.7% |
| Standard Deviation (Sample) | 2.1% | 2.0% |
| Standard Deviation (Population) | 2.1% | 2.0% |
Similar Demographics by Professional Degree
Demographics Similar to Asians by Professional Degree
In terms of professional degree, the demographic groups most similar to Asians are Immigrants from Asia (5.5%, a difference of 0.060%), Immigrants from Bolivia (5.5%, a difference of 0.13%), Immigrants from Kazakhstan (5.5%, a difference of 0.36%), Immigrants from Belarus (5.5%, a difference of 0.43%), and Immigrants from Bulgaria (5.5%, a difference of 0.69%).
| Demographics | Rating | Rank | Professional Degree |
| Immigrants | Malaysia | 100.0 /100 | #56 | Exceptional 5.7% |
| South Africans | 100.0 /100 | #57 | Exceptional 5.7% |
| Bulgarians | 100.0 /100 | #58 | Exceptional 5.7% |
| Immigrants | Europe | 100.0 /100 | #59 | Exceptional 5.6% |
| Bolivians | 99.9 /100 | #60 | Exceptional 5.6% |
| Immigrants | Lithuania | 99.9 /100 | #61 | Exceptional 5.6% |
| Immigrants | Belarus | 99.9 /100 | #62 | Exceptional 5.5% |
| Asians | 99.9 /100 | #63 | Exceptional 5.5% |
| Immigrants | Asia | 99.9 /100 | #64 | Exceptional 5.5% |
| Immigrants | Bolivia | 99.9 /100 | #65 | Exceptional 5.5% |
| Immigrants | Kazakhstan | 99.9 /100 | #66 | Exceptional 5.5% |
| Immigrants | Bulgaria | 99.9 /100 | #67 | Exceptional 5.5% |
| Immigrants | Lebanon | 99.9 /100 | #68 | Exceptional 5.5% |
| Immigrants | Hungary | 99.9 /100 | #69 | Exceptional 5.5% |
| Bhutanese | 99.8 /100 | #70 | Exceptional 5.4% |
Demographics Similar to Tlingit-Haida by Professional Degree
In terms of professional degree, the demographic groups most similar to Tlingit-Haida are Trinidadian and Tobagonian (4.0%, a difference of 0.13%), Immigrants from Bosnia and Herzegovina (4.0%, a difference of 0.27%), Immigrants from Western Africa (4.0%, a difference of 0.35%), German Russian (4.0%, a difference of 0.55%), and French Canadian (4.0%, a difference of 0.60%).
| Demographics | Rating | Rank | Professional Degree |
| Dutch | 9.0 /100 | #218 | Tragic 4.0% |
| Immigrants | South Eastern Asia | 8.9 /100 | #219 | Tragic 4.0% |
| Ute | 8.2 /100 | #220 | Tragic 4.0% |
| French Canadians | 8.0 /100 | #221 | Tragic 4.0% |
| Immigrants | Western Africa | 7.5 /100 | #222 | Tragic 4.0% |
| Immigrants | Bosnia and Herzegovina | 7.4 /100 | #223 | Tragic 4.0% |
| Trinidadians and Tobagonians | 7.1 /100 | #224 | Tragic 4.0% |
| Tlingit-Haida | 6.9 /100 | #225 | Tragic 4.0% |
| German Russians | 6.1 /100 | #226 | Tragic 4.0% |
| Cubans | 5.9 /100 | #227 | Tragic 4.0% |
| Immigrants | West Indies | 5.6 /100 | #228 | Tragic 4.0% |
| Immigrants | Burma/Myanmar | 5.4 /100 | #229 | Tragic 3.9% |
| Nicaraguans | 5.1 /100 | #230 | Tragic 3.9% |
| Ecuadorians | 4.6 /100 | #231 | Tragic 3.9% |
| Cree | 4.3 /100 | #232 | Tragic 3.9% |