Asian vs Portuguese Bachelor's Degree
COMPARE
Asian
Portuguese
Bachelor's Degree
Bachelor's Degree Comparison
Asians
Portuguese
44.4%
BACHELOR'S DEGREE
99.9/ 100
METRIC RATING
51st/ 347
METRIC RANK
35.5%
BACHELOR'S DEGREE
7.2/ 100
METRIC RATING
226th/ 347
METRIC RANK
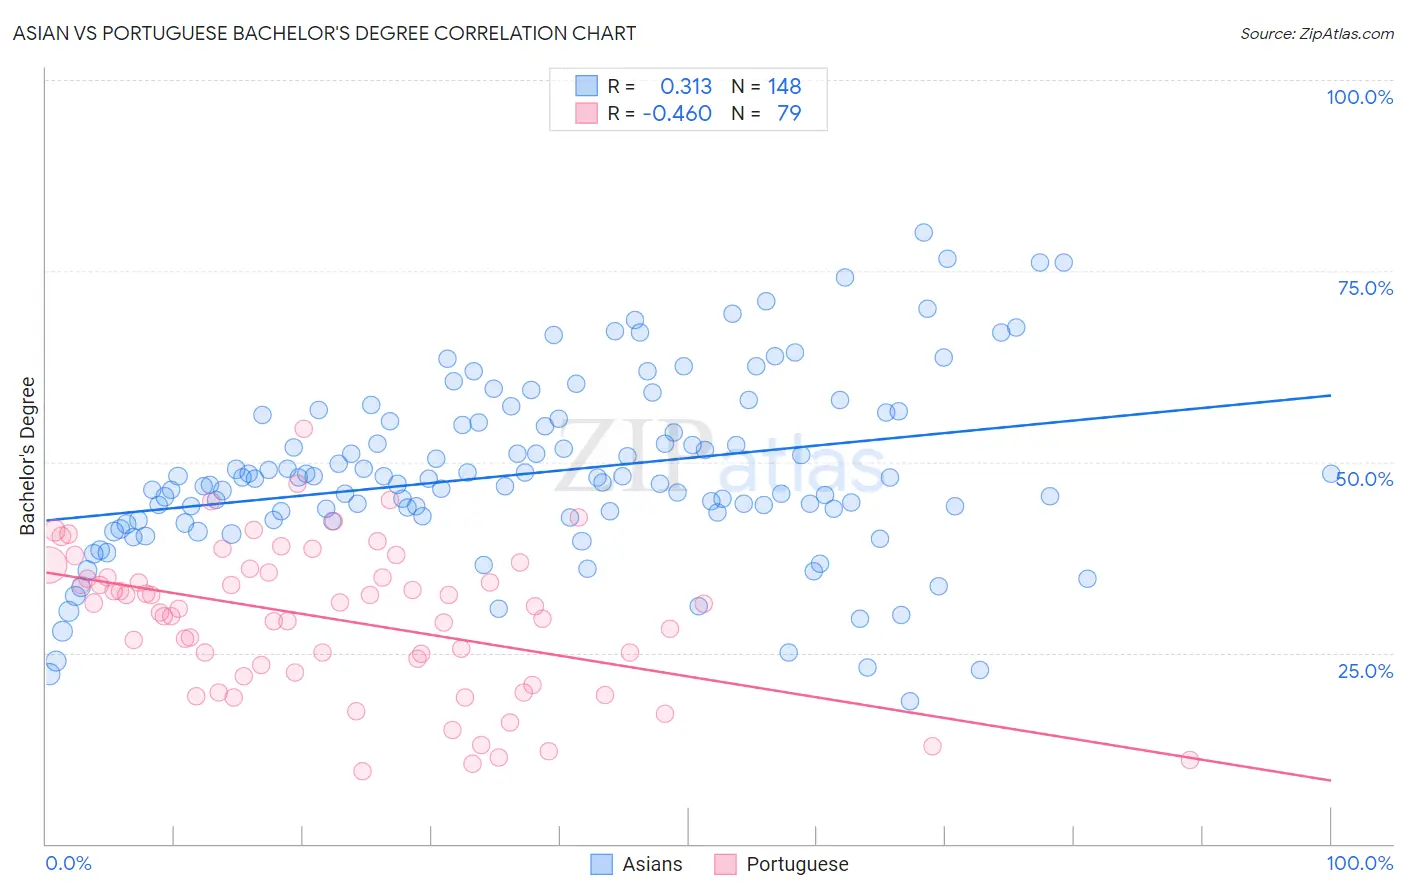
Asian vs Portuguese Bachelor's Degree Correlation Chart
The statistical analysis conducted on geographies consisting of 550,793,799 people shows a mild positive correlation between the proportion of Asians and percentage of population with at least bachelor's degree education in the United States with a correlation coefficient (R) of 0.313 and weighted average of 44.4%. Similarly, the statistical analysis conducted on geographies consisting of 450,314,752 people shows a moderate negative correlation between the proportion of Portuguese and percentage of population with at least bachelor's degree education in the United States with a correlation coefficient (R) of -0.460 and weighted average of 35.5%, a difference of 25.1%.
Bachelor's Degree Correlation Summary
| Measurement | Asian | Portuguese |
| Minimum | 18.6% | 9.4% |
| Maximum | 80.1% | 54.4% |
| Range | 61.5% | 45.0% |
| Mean | 48.5% | 29.4% |
| Median | 47.5% | 31.1% |
| Interquartile 25% (IQ1) | 42.5% | 22.5% |
| Interquartile 75% (IQ3) | 55.2% | 35.6% |
| Interquartile Range (IQR) | 12.7% | 13.1% |
| Standard Deviation (Sample) | 11.7% | 9.6% |
| Standard Deviation (Population) | 11.7% | 9.5% |
Similar Demographics by Bachelor's Degree
Demographics Similar to Asians by Bachelor's Degree
In terms of bachelor's degree, the demographic groups most similar to Asians are Immigrants from Greece (44.5%, a difference of 0.14%), Immigrants from Spain (44.3%, a difference of 0.18%), Immigrants from Asia (44.3%, a difference of 0.24%), Immigrants from Norway (44.5%, a difference of 0.25%), and Bolivian (44.6%, a difference of 0.38%).
| Demographics | Rating | Rank | Bachelor's Degree |
| Immigrants | Lithuania | 99.9 /100 | #44 | Exceptional 44.6% |
| Immigrants | Kuwait | 99.9 /100 | #45 | Exceptional 44.6% |
| Immigrants | Bulgaria | 99.9 /100 | #46 | Exceptional 44.6% |
| Bolivians | 99.9 /100 | #47 | Exceptional 44.6% |
| Estonians | 99.9 /100 | #48 | Exceptional 44.6% |
| Immigrants | Norway | 99.9 /100 | #49 | Exceptional 44.5% |
| Immigrants | Greece | 99.9 /100 | #50 | Exceptional 44.5% |
| Asians | 99.9 /100 | #51 | Exceptional 44.4% |
| Immigrants | Spain | 99.9 /100 | #52 | Exceptional 44.3% |
| Immigrants | Asia | 99.9 /100 | #53 | Exceptional 44.3% |
| Immigrants | Austria | 99.9 /100 | #54 | Exceptional 44.2% |
| Immigrants | Bolivia | 99.9 /100 | #55 | Exceptional 44.2% |
| Immigrants | Serbia | 99.9 /100 | #56 | Exceptional 44.1% |
| Paraguayans | 99.9 /100 | #57 | Exceptional 44.0% |
| Immigrants | Czechoslovakia | 99.9 /100 | #58 | Exceptional 44.0% |
Demographics Similar to Portuguese by Bachelor's Degree
In terms of bachelor's degree, the demographic groups most similar to Portuguese are Immigrants from Burma/Myanmar (35.5%, a difference of 0.040%), Immigrants from Barbados (35.5%, a difference of 0.11%), Ecuadorian (35.4%, a difference of 0.26%), French Canadian (35.6%, a difference of 0.38%), and Immigrants from Trinidad and Tobago (35.3%, a difference of 0.49%).
| Demographics | Rating | Rank | Bachelor's Degree |
| West Indians | 9.7 /100 | #219 | Tragic 35.8% |
| Spanish | 9.6 /100 | #220 | Tragic 35.8% |
| Dutch | 9.2 /100 | #221 | Tragic 35.7% |
| Trinidadians and Tobagonians | 8.8 /100 | #222 | Tragic 35.7% |
| French Canadians | 8.3 /100 | #223 | Tragic 35.6% |
| Immigrants | Barbados | 7.5 /100 | #224 | Tragic 35.5% |
| Immigrants | Burma/Myanmar | 7.3 /100 | #225 | Tragic 35.5% |
| Portuguese | 7.2 /100 | #226 | Tragic 35.5% |
| Ecuadorians | 6.6 /100 | #227 | Tragic 35.4% |
| Immigrants | Trinidad and Tobago | 6.0 /100 | #228 | Tragic 35.3% |
| Whites/Caucasians | 5.9 /100 | #229 | Tragic 35.3% |
| Immigrants | Grenada | 4.3 /100 | #230 | Tragic 35.0% |
| Immigrants | St. Vincent and the Grenadines | 4.3 /100 | #231 | Tragic 35.0% |
| Hmong | 3.4 /100 | #232 | Tragic 34.8% |
| Immigrants | Ecuador | 3.3 /100 | #233 | Tragic 34.7% |