Asian vs Immigrants from Malaysia 11th Grade
COMPARE
Asian
Immigrants from Malaysia
11th Grade
11th Grade Comparison
Asians
Immigrants from Malaysia
92.5%
11TH GRADE
50.0/ 100
METRIC RATING
174th/ 347
METRIC RANK
92.4%
11TH GRADE
37.6/ 100
METRIC RATING
183rd/ 347
METRIC RANK
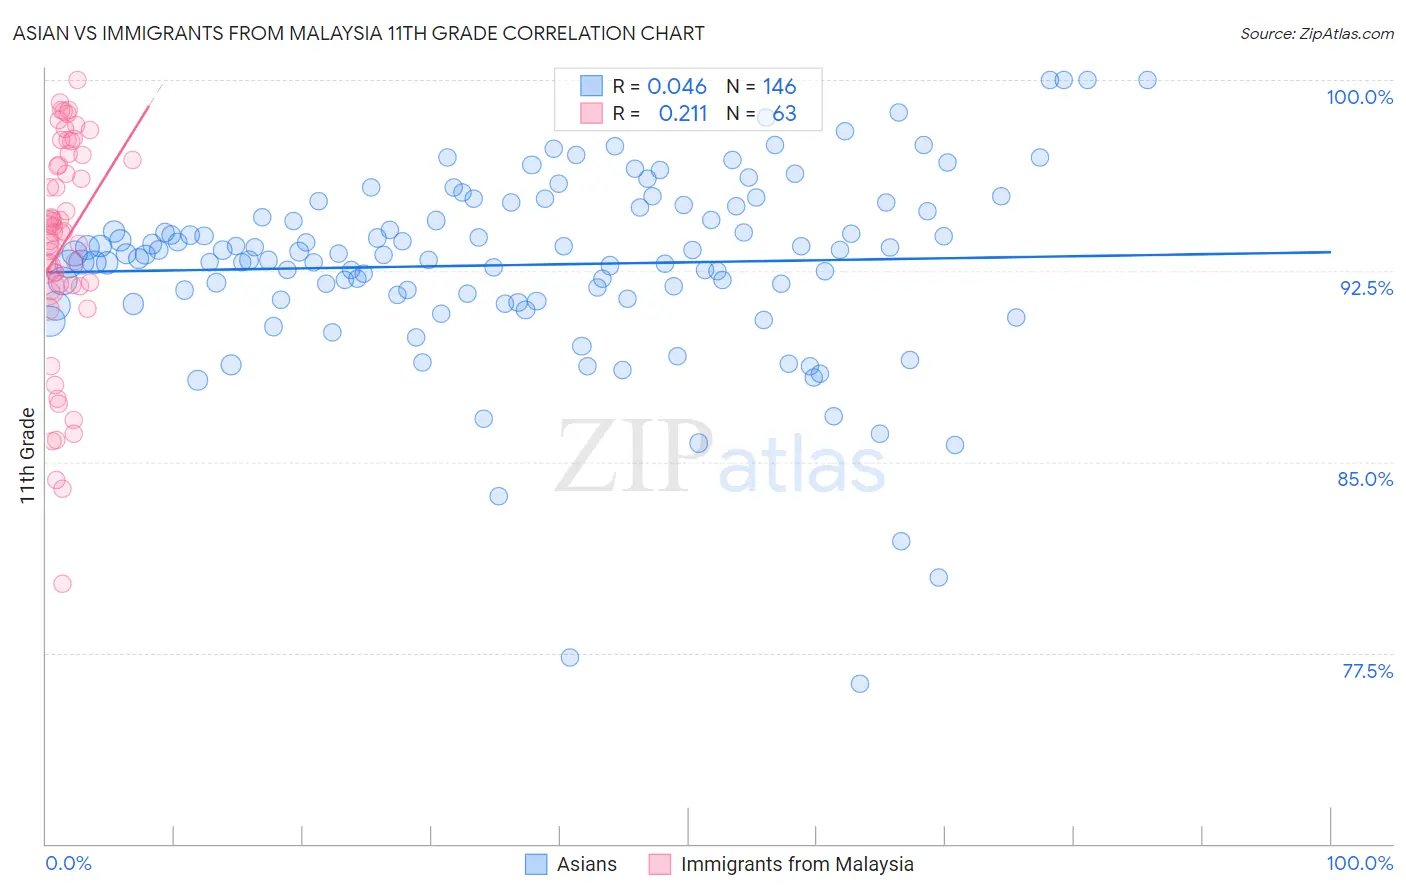
Asian vs Immigrants from Malaysia 11th Grade Correlation Chart
The statistical analysis conducted on geographies consisting of 550,778,127 people shows no correlation between the proportion of Asians and percentage of population with at least 11th grade education in the United States with a correlation coefficient (R) of 0.046 and weighted average of 92.5%. Similarly, the statistical analysis conducted on geographies consisting of 197,973,709 people shows a weak positive correlation between the proportion of Immigrants from Malaysia and percentage of population with at least 11th grade education in the United States with a correlation coefficient (R) of 0.211 and weighted average of 92.4%, a difference of 0.12%.
11th Grade Correlation Summary
| Measurement | Asian | Immigrants from Malaysia |
| Minimum | 76.3% | 80.2% |
| Maximum | 100.0% | 100.0% |
| Range | 23.7% | 19.8% |
| Mean | 92.7% | 93.5% |
| Median | 93.2% | 94.0% |
| Interquartile 25% (IQ1) | 91.4% | 91.9% |
| Interquartile 75% (IQ3) | 95.0% | 97.0% |
| Interquartile Range (IQR) | 3.6% | 5.1% |
| Standard Deviation (Sample) | 3.8% | 4.3% |
| Standard Deviation (Population) | 3.7% | 4.3% |
Demographics Similar to Asians and Immigrants from Malaysia by 11th Grade
In terms of 11th grade, the demographic groups most similar to Asians are Shoshone (92.5%, a difference of 0.010%), Immigrants from Pakistan (92.5%, a difference of 0.020%), Indian (Asian) (92.5%, a difference of 0.020%), Spaniard (92.5%, a difference of 0.030%), and Laotian (92.6%, a difference of 0.040%). Similarly, the demographic groups most similar to Immigrants from Malaysia are Immigrants from Asia (92.4%, a difference of 0.0%), Immigrants from Morocco (92.4%, a difference of 0.010%), Immigrants from Nepal (92.4%, a difference of 0.010%), Creek (92.4%, a difference of 0.030%), and Inupiat (92.4%, a difference of 0.030%).
| Demographics | Rating | Rank | 11th Grade |
| Sierra Leoneans | 58.7 /100 | #168 | Average 92.6% |
| Immigrants | Albania | 57.8 /100 | #169 | Average 92.6% |
| Immigrants | Northern Africa | 57.3 /100 | #170 | Average 92.6% |
| Laotians | 54.4 /100 | #171 | Average 92.6% |
| Immigrants | Pakistan | 52.3 /100 | #172 | Average 92.5% |
| Indians (Asian) | 51.5 /100 | #173 | Average 92.5% |
| Asians | 50.0 /100 | #174 | Average 92.5% |
| Shoshone | 48.9 /100 | #175 | Average 92.5% |
| Spaniards | 46.9 /100 | #176 | Average 92.5% |
| Guamanians/Chamorros | 45.0 /100 | #177 | Average 92.5% |
| Sudanese | 43.4 /100 | #178 | Average 92.5% |
| Creek | 40.9 /100 | #179 | Average 92.4% |
| Inupiat | 40.7 /100 | #180 | Average 92.4% |
| Cherokee | 40.7 /100 | #181 | Average 92.4% |
| Immigrants | Morocco | 38.6 /100 | #182 | Fair 92.4% |
| Immigrants | Malaysia | 37.6 /100 | #183 | Fair 92.4% |
| Immigrants | Asia | 37.4 /100 | #184 | Fair 92.4% |
| Immigrants | Nepal | 36.4 /100 | #185 | Fair 92.4% |
| Arapaho | 35.1 /100 | #186 | Fair 92.4% |
| Immigrants | Western Asia | 35.0 /100 | #187 | Fair 92.4% |
| Immigrants | Indonesia | 33.7 /100 | #188 | Fair 92.4% |