Asian vs Immigrants from Korea 4th Grade
COMPARE
Asian
Immigrants from Korea
4th Grade
4th Grade Comparison
Asians
Immigrants from Korea
97.1%
4TH GRADE
1.4/ 100
METRIC RATING
242nd/ 347
METRIC RANK
97.5%
4TH GRADE
50.6/ 100
METRIC RATING
173rd/ 347
METRIC RANK
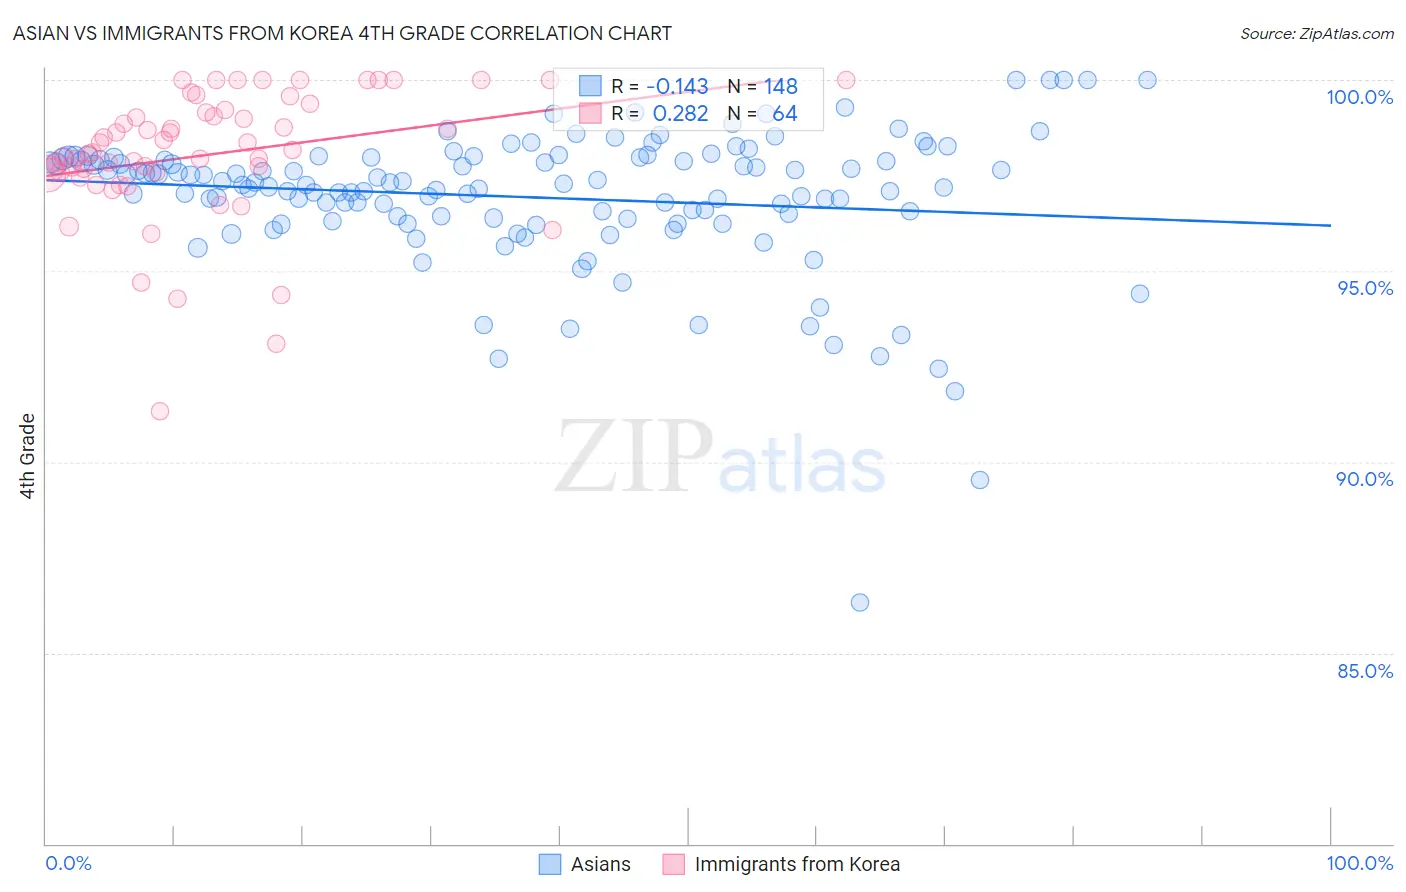
Asian vs Immigrants from Korea 4th Grade Correlation Chart
The statistical analysis conducted on geographies consisting of 550,860,618 people shows a poor negative correlation between the proportion of Asians and percentage of population with at least 4th grade education in the United States with a correlation coefficient (R) of -0.143 and weighted average of 97.1%. Similarly, the statistical analysis conducted on geographies consisting of 416,280,076 people shows a weak positive correlation between the proportion of Immigrants from Korea and percentage of population with at least 4th grade education in the United States with a correlation coefficient (R) of 0.282 and weighted average of 97.5%, a difference of 0.41%.
4th Grade Correlation Summary
| Measurement | Asian | Immigrants from Korea |
| Minimum | 86.3% | 91.3% |
| Maximum | 100.0% | 100.0% |
| Range | 13.7% | 8.7% |
| Mean | 96.9% | 98.0% |
| Median | 97.3% | 98.1% |
| Interquartile 25% (IQ1) | 96.4% | 97.6% |
| Interquartile 75% (IQ3) | 97.9% | 99.2% |
| Interquartile Range (IQR) | 1.5% | 1.6% |
| Standard Deviation (Sample) | 1.9% | 1.7% |
| Standard Deviation (Population) | 1.9% | 1.7% |
Similar Demographics by 4th Grade
Demographics Similar to Asians by 4th Grade
In terms of 4th grade, the demographic groups most similar to Asians are U.S. Virgin Islander (97.1%, a difference of 0.0%), Colombian (97.1%, a difference of 0.010%), Immigrants from Indonesia (97.1%, a difference of 0.010%), Korean (97.1%, a difference of 0.010%), and Immigrants from Eastern Africa (97.1%, a difference of 0.010%).
| Demographics | Rating | Rank | 4th Grade |
| Yuman | 2.9 /100 | #235 | Tragic 97.2% |
| Immigrants | Eastern Asia | 2.7 /100 | #236 | Tragic 97.2% |
| Immigrants | Costa Rica | 2.0 /100 | #237 | Tragic 97.2% |
| Indians (Asian) | 1.9 /100 | #238 | Tragic 97.2% |
| Nigerians | 1.8 /100 | #239 | Tragic 97.1% |
| Colombians | 1.6 /100 | #240 | Tragic 97.1% |
| Immigrants | Indonesia | 1.5 /100 | #241 | Tragic 97.1% |
| Asians | 1.4 /100 | #242 | Tragic 97.1% |
| U.S. Virgin Islanders | 1.4 /100 | #243 | Tragic 97.1% |
| Koreans | 1.3 /100 | #244 | Tragic 97.1% |
| Immigrants | Eastern Africa | 1.2 /100 | #245 | Tragic 97.1% |
| Immigrants | Uruguay | 1.2 /100 | #246 | Tragic 97.1% |
| Ethiopians | 1.2 /100 | #247 | Tragic 97.1% |
| Immigrants | Asia | 1.2 /100 | #248 | Tragic 97.1% |
| Immigrants | Africa | 1.0 /100 | #249 | Tragic 97.1% |
Demographics Similar to Immigrants from Korea by 4th Grade
In terms of 4th grade, the demographic groups most similar to Immigrants from Korea are Immigrants from Spain (97.5%, a difference of 0.0%), Brazilian (97.5%, a difference of 0.0%), Immigrants from Sri Lanka (97.5%, a difference of 0.0%), Egyptian (97.5%, a difference of 0.0%), and Immigrants from Micronesia (97.5%, a difference of 0.0%).
| Demographics | Rating | Rank | 4th Grade |
| Kenyans | 56.5 /100 | #166 | Average 97.5% |
| Immigrants | Poland | 55.9 /100 | #167 | Average 97.5% |
| Immigrants | Belarus | 55.8 /100 | #168 | Average 97.5% |
| Chileans | 54.4 /100 | #169 | Average 97.5% |
| Immigrants | Spain | 51.8 /100 | #170 | Average 97.5% |
| Brazilians | 51.5 /100 | #171 | Average 97.5% |
| Immigrants | Sri Lanka | 51.1 /100 | #172 | Average 97.5% |
| Immigrants | Korea | 50.6 /100 | #173 | Average 97.5% |
| Egyptians | 50.0 /100 | #174 | Average 97.5% |
| Immigrants | Micronesia | 49.6 /100 | #175 | Average 97.5% |
| Arabs | 48.7 /100 | #176 | Average 97.5% |
| Immigrants | Brazil | 46.1 /100 | #177 | Average 97.5% |
| Comanche | 45.3 /100 | #178 | Average 97.5% |
| Immigrants | Kazakhstan | 43.6 /100 | #179 | Average 97.5% |
| Immigrants | Venezuela | 42.7 /100 | #180 | Average 97.5% |